
Technical analysis for 13th April 2026
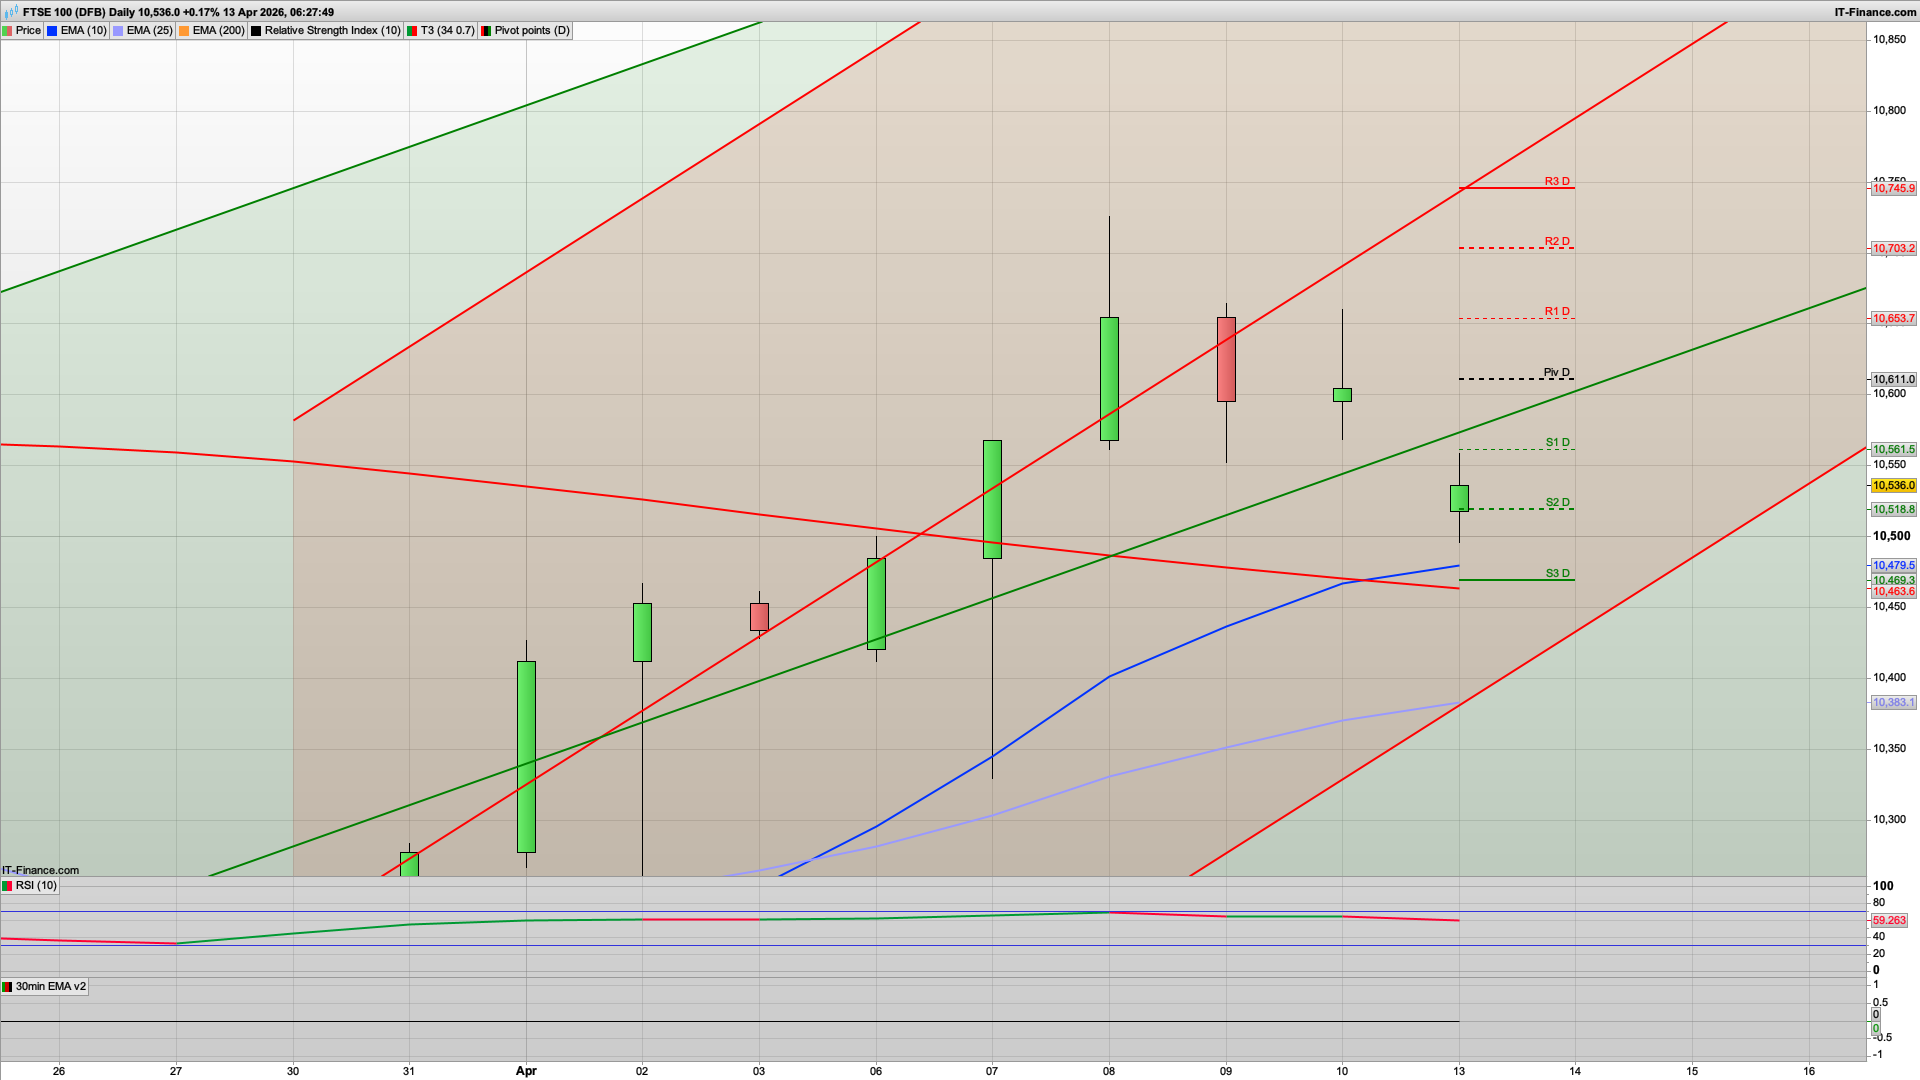
FTSE 100 — Bearish
- What I see
- Clear rejection from highs
- Trading below pivot
- Lower highs forming
- Bias: Sell rallies
- Weak like DAX (Europe underperforming)
DAX — Bearish (weakest today)
- What I see
- Clean breakdown below pivot
- Multiple red candles after rejection at channel high
- Now sitting near lower channel / S levels
- Bias: Sell rallies
- Momentum has flipped
- Likely continuation toward S2 / S3 zone
- Any bounce into pivot = short opportunity
NASDAQ — Neutral → slight bullish
- What I see
- Still structurally bullish (higher highs intact)
- But now pulling back into S1/S2 area
- No aggressive selling
- Bias: Buy dips IF support holds
- Otherwise range
- Stronger than DAX/FTSE
S&P 500 — Neutral / range
- What I see
- Holding structure but lost momentum
- Sitting mid-range (pivot area)
- No clear directional candle
- Bias: Range conditions
- Fade highs/lows
GOLD — Bullish reversal attempt
- What I see
- Strong bullish candle off support
- Holding above S levels
- Momentum turning up again
- Bias: Buy dips
- Potential push back toward R1/R2
Plan
- Primary: Buy 10,510–10,530 support
- Secondary: Sell breakdown below 10,500
- Alternative: Buy reclaim above 10,610
Another Monday morning with the gap down to start with after the weekend news regarding the Middle East and the Strait being closed still and talks collapsing.... initially at least. If we follow the pattern of the past few Mondays then we will likely see a rise for a gap close before more selling later on, with potential rises towards the daily pivots on each market looking like the main play to start with.
For the FTSE100 this means a potential rise towards the 10600/10611 area before another slide down. If the bulls were to break above this daily pivot though then look to get long on that break as it will likely see a rise towards the 10653 R1 level and possibly higher. Might be a news driven break for that. Above 10650 then 10703 is R2 and with the round number here any rise may well falter here, and it's also just above the 10685 key fib, and the 10688 daily resistance. The other level to look for this week is the 10780 area where we have the next daily level of note.
For the bears then if the pivot does hold as resistance and they drive it back down then the overnight low at 10500 and just below 10518 S2 is next, with the S3 level 10469 below that. We may well also be on for a test of the 25ema on the daily chart at 10385 currently at some point soon, as the daily chart EMAs remain bullish for the time being - and in fact thats the case for the S&P500, NASDAQ and weakly on the Dax as well. On the S&P500 this level is 6680 so keep an eye on that for a bounce.
With the key fib and the S2 level around the 10515 area then I would ideally like to see this hold today and the US to drag it back up as they go for the gap close.
Good luck today.
Interested in how to start trading the FTSE 100? Frequently Asked Questions on Spread betting
Recommended Broker for trading - MT4/5, web and mobile

IC Markets - offers market leading pricing and trading conditions by providing clients with True ECN Connectivity; this allows you to trade on institutional grade liquidity from the world’s leading investment banks, hedge funds and dark pool liquidity execution venues. Highly recommended!
Join my Membership for Trading Tips, Support and Resistance Levels with Live Trading
If you would like more detailed analysis for FTSE 100, DAX40, Gold and the S&P500, including the trades that I am looking to take myself, then please join my active members community.
Keep up to date with new website posts, free sign up below
