
Technical analysis for 6th July 2026
We start the new trading week with the broader tone still supportive for equities after Friday’s strong finish, but I think today is more likely to be about follow-through versus digestion rather than a straight-line trend day. Last week’s weaker US payrolls data reduced rate-hike expectations and helped risk assets finish the week on the front foot, with global equities posting one of their strongest weeks since May. Gold also found support from the softer dollar and lower yields, so the picture going into today is a little more balanced than it was earlier in the week.
For me, the main question today is whether the indices can build on Friday’s strength without immediately giving it back. The FTSE and DAX both still look constructive, and the S&P 500 remains in a broader uptrend, but after the recent push higher I wouldn’t be surprised to see some early consolidation before the next directional move. Gold is the one market that has improved the most from a tactical point of view, but I still want to see whether buyers can actually hold onto last week’s rebound rather than simply produce a short-covering bounce.
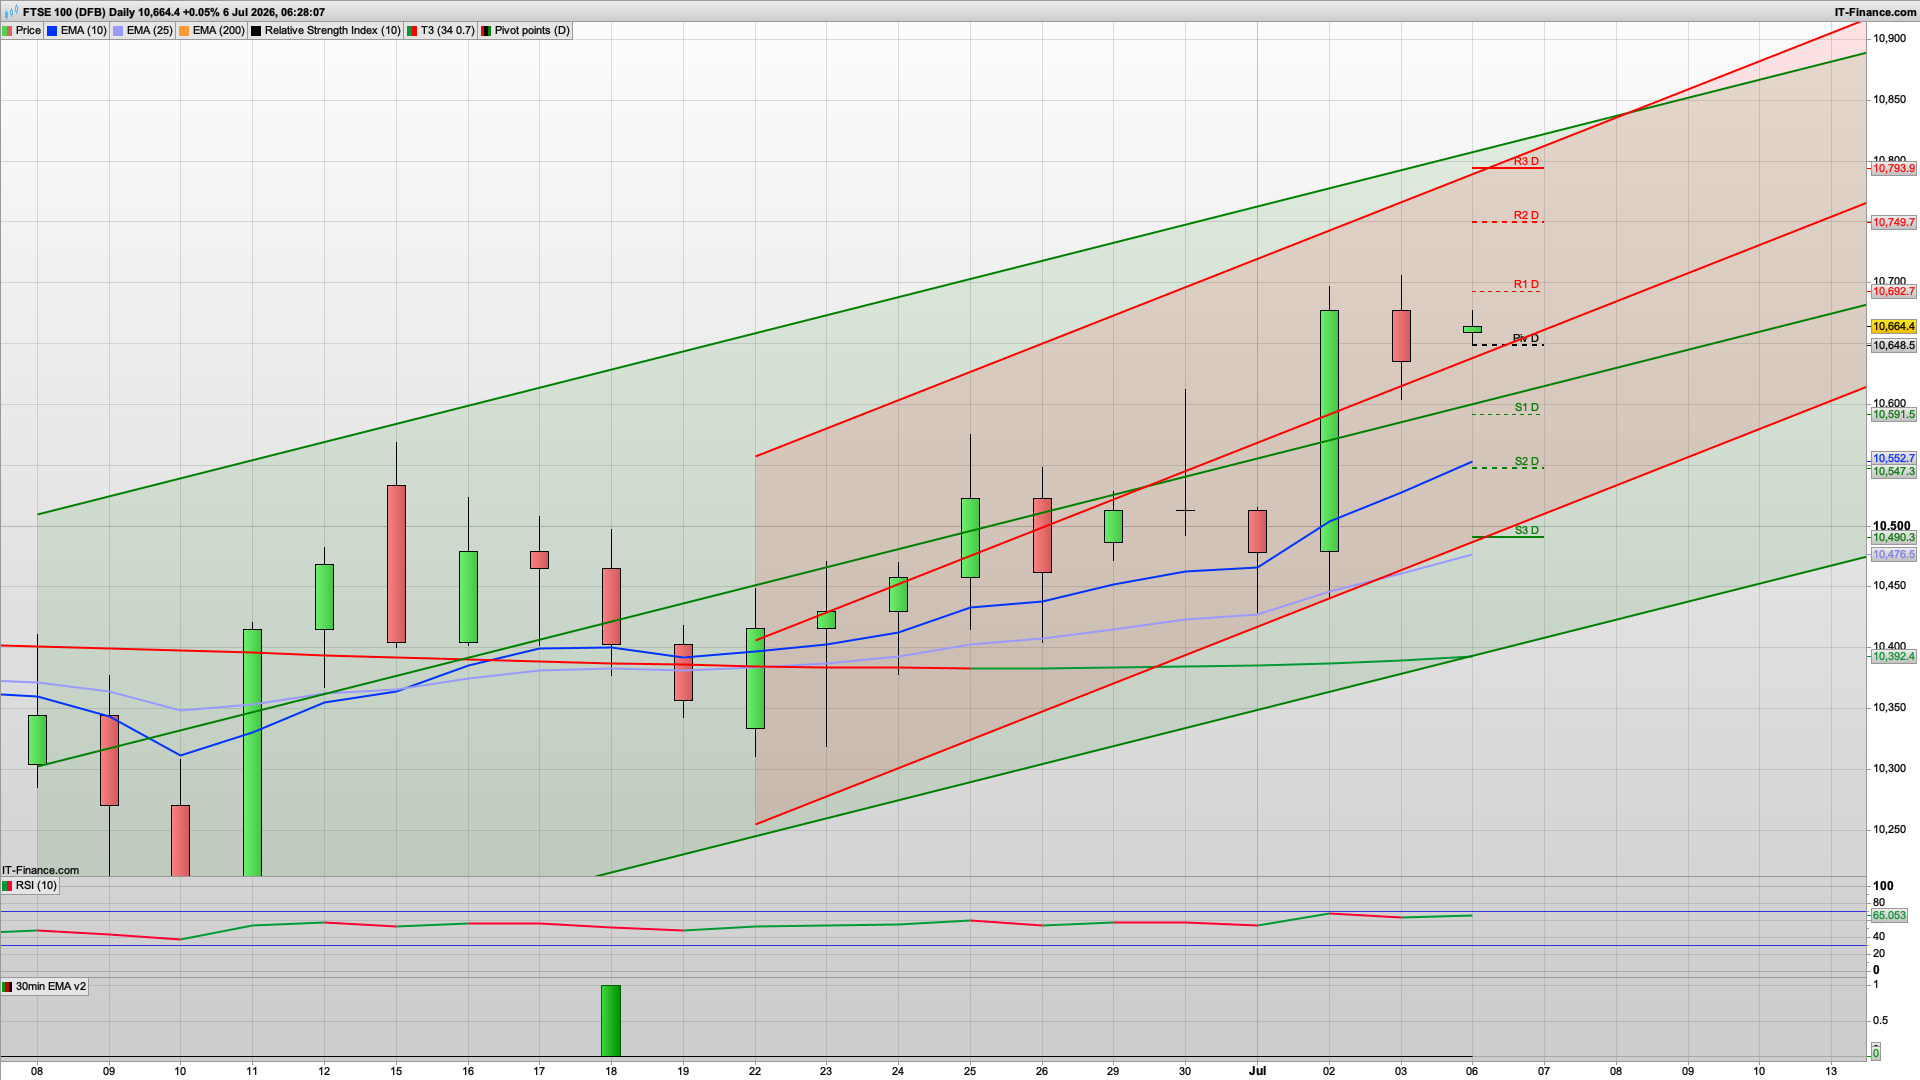
FTSE 100
- Bias: bullish continuation / strongest chart
- FTSE still has the cleanest rising channel and is sitting in the upper half of that structure.
- Price is above both key moving averages and the EMA25 is rising strongly.
- Friday’s candle was only a modest pause after the big breakout candle, which is constructive rather than bearish.
- RSI is around 65, so momentum is still supportive without being as stretched as DAX.
- Bullish above the pivot zone / 10,591 support.
- Of the indices, FTSE still looks like the cleanest buy-the-dip daily chart.
DAX40
- Bias: buy dips / bullish continuation
- Daily structure is still a clear rising channel with price holding in the upper half of that channel.
- Price is well above the EMA25 and EMA200, so trend structure is still positive.
- Last week’s push higher remains intact; today is more of a pause candle than a reversal candle.
- RSI is around 70, so momentum is strong, but it’s also getting a bit stretched.
- As long as DAX holds above the 25,749 pivot / 25,666 support zone, I’d keep a bullish daily bias.
- The better trade is buying a dip rather than chasing the highs into R1/R2, but.....
Nasdaq 100
- Bias: mixed / underperforming
- This is still the least convincing of the indices.
- Price is sitting around the pivot / EMA cluster, not really extending higher like DAX/FTSE/S&P.
- The chart is basically stuck in a messy sideways-to-soft-down structure after the failed rally.
- It’s not a clean short trend, but it’s also not giving a strong long continuation signal.
- For me this stays neutral to slightly bearish unless it can reclaim and hold above 29,742–29,822.
- Below the pivot, I’d expect more chop / underperformance rather than clean upside trend.
S&P 500
- Bias: bullish, but not as clean as FTSE/DAX
- Price remains above the key moving averages and is still in a rising daily structure.
- The market is holding above the EMA25/EMA200 cluster, which keeps the broader trend positive.
- The recent move has been a grind higher rather than an impulsive breakout, but the trend is still up.
- Today’s candle is sitting just under the pivot / resistance cluster, so it’s a “bullish but needs follow-through” setup.
- Still bullish while above 7,494–7,483.
- If it can get back above 7,503 pivot and start holding there, I’d expect another attempt higher.
Gold
- Bias: recovery stalling / fading strength
- Gold had a decent rebound, but today’s candle is failing back under the pivot area after running into resistance.
- Price is still below the EMA200 and the broader daily structure is not convincingly bullish yet.
- It’s trapped in a broad consolidation / damaged trend structure rather than trending cleanly.
- The last push higher looks more like a countertrend rebound than a true breakout.
- I’d downgrade gold from bullish rebound to neutral / slightly bearish for today.
- If it stays below 4,164 pivot, I’d be wary of the rebound fading back toward 4,132 / 4,089.
My practical bias for the session
- Best long-bias markets
- FTSE – bullish above 10,649 / 10,591
- DAX – bullish above 25,749 / 25,666
- S&P – bullish above 7,494
- More cautious / tactical only
- Nasdaq – neutral to slightly bearish unless it reclaims 29,742+
- Gold – neutral to slightly bearish while below 4,164
For today, I still think the equity indices are the cleaner markets, particularly the FTSE100 and DAX40, where the structure remains constructive and the preferred approach is still to buy controlled weakness rather than chase stretched moves. The S&P 500 remains bullish overall too, but I suspect it may be a little less straightforward after last week’s run and may need to consolidate before the next cleaner opportunity appears.
Gold is the one market where the tone has improved the most. The bounce has been meaningful enough to soften the bearish view, but not yet strong enough for me to treat it as a high-conviction trend market. For now, I think it’s a market to treat tactically rather than emotionally — let it prove whether buyers can actually hold the gains.
Interested in how to start trading the FTSE 100? Frequently Asked Questions on Spread betting
Recommended Broker for trading - MT4/5, web and mobile

IC Markets - offers market leading pricing and trading conditions by providing clients with True ECN Connectivity; this allows you to trade on institutional grade liquidity from the world’s leading investment banks, hedge funds and dark pool liquidity execution venues. Highly recommended!
Join my Membership for Trading Tips, Support and Resistance Levels with Live Trading
If you would like more detailed analysis for FTSE 100, DAX40, Gold and the S&P500, including the trades that I am looking to take myself, then please join my active members community.
Keep up to date with new website posts, free sign up below
