
Technical analysis for 13th February 2026
FTSE100 Bias
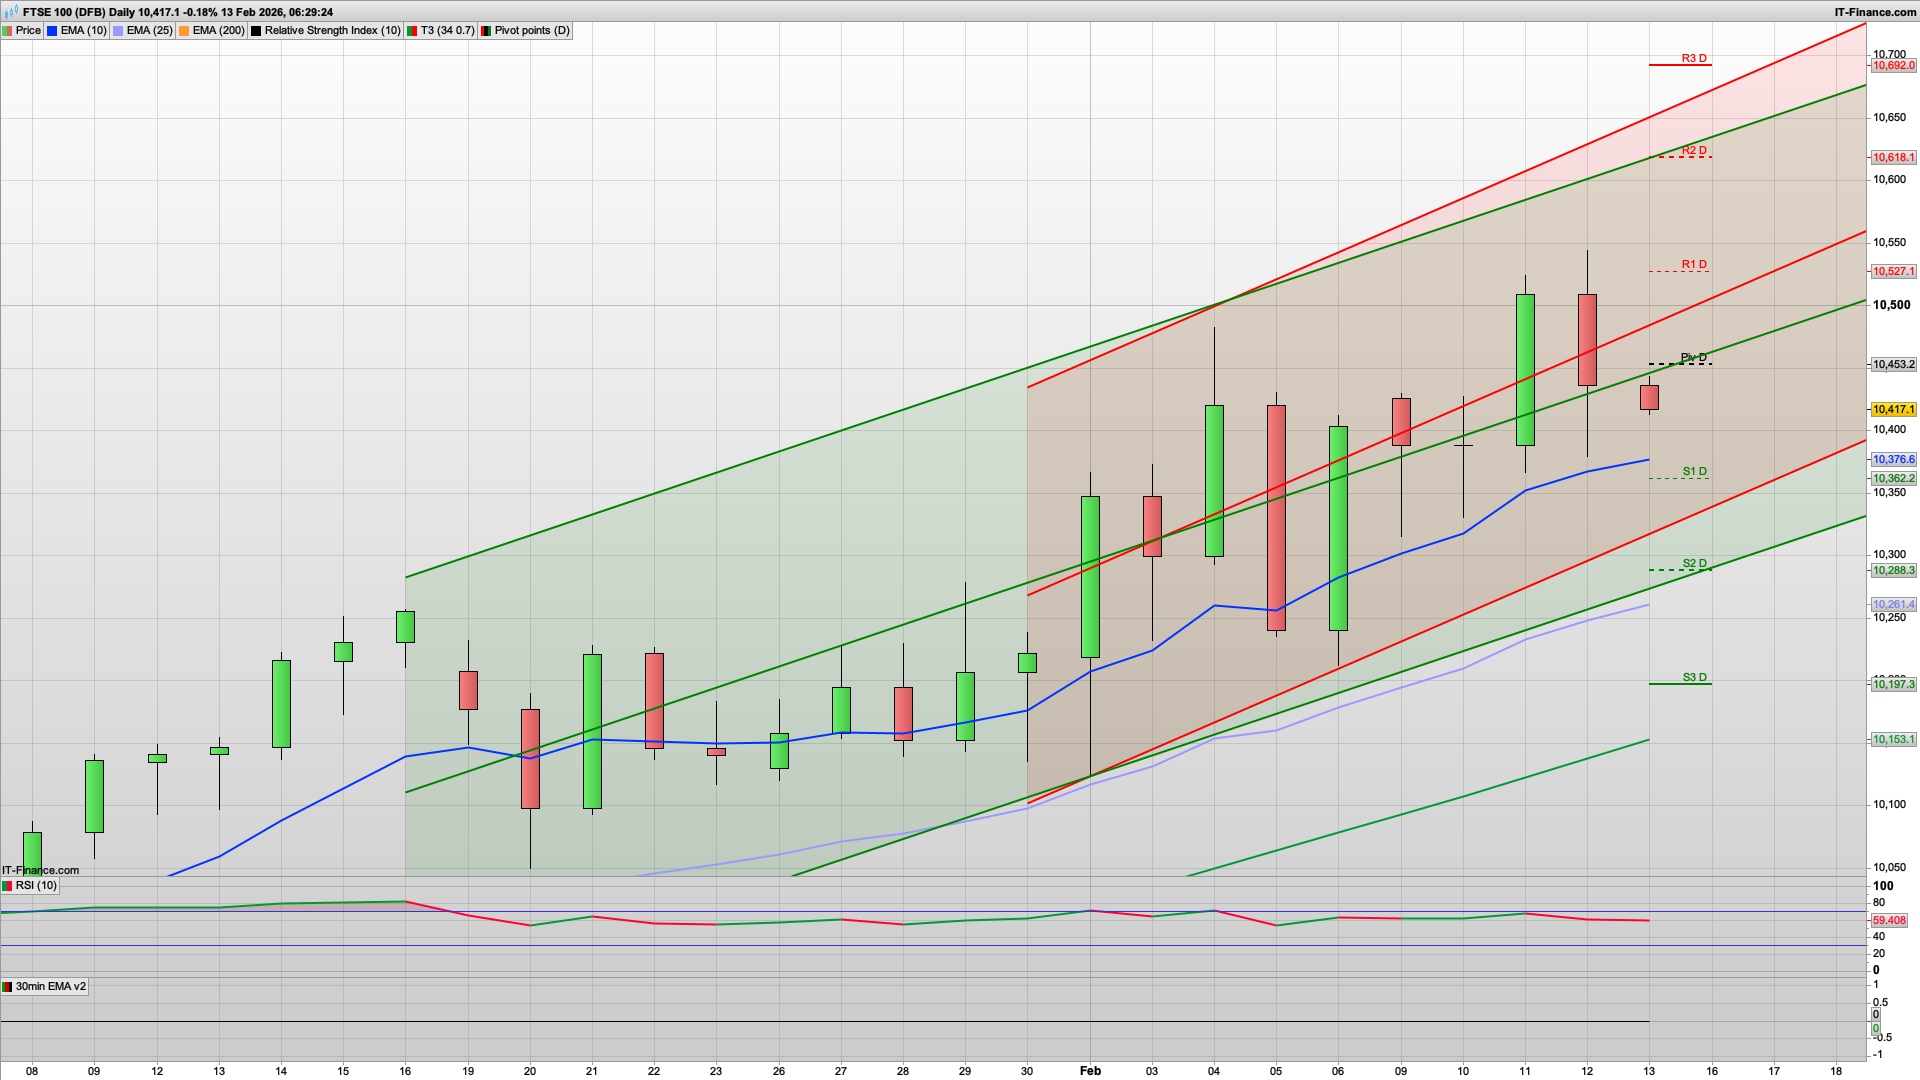
- Daily Bias: Bullish pullback → buy dips
- Structure
- Price holding inside rising channel
- EMAs stacked bullish
- Pullback candle into support, not breakdown
- Key levels
- Pivot ≈ 10,450
- Support zone: 10,360 – 10,300
- Resistance: 10,525 → 10,620
- Plan
- Bias is buy dips while above pivot.
- Best longs: pullback into S1/channel support
- Acceptance above 10,525 → continuation push
- Break and hold below 10,300 = bias neutral.
S&P500 Bias
- Daily Bias: Range → bullish tilt
- Structure
- Range behaviour inside upward channel
- Pivot acting as balance point
- Buyers stepping in after sell candle
- Key levels
- Pivot ≈ 6,875
- Support: 6,815 → 6,780
- Resistance: 6,930 → 7,000
- Plan
- Bias = buy dips above pivot.
- Long setups near S1/channel support
- Acceptance above 6,930 → trend resumption
- Break and hold below 6,780 = range expansion down.
DAX40 Bias
- Daily Bias: Bullish continuation
- Structure
- Higher low printed
- Trend channel intact
- Buyers defending pivot/EMA cluster
- Key levels
- Pivot ≈ 24,980
- Support: 24,800 – 24,735
- Resistance: 25,165 → 25,415
- Plan
- Bias = buy dips / continuation higher.
- Pullbacks into pivot/channel = long zone
- Clean push above 25,165 opens trend extension
- Lose 24,735 → momentum slows.
The bulls lost the battle yesterday as the drop off 10540 accelerated to 10380 before a small bounce. That sets up the 10390 as the first main support this morning and then 10362 S1 and daily support below that. A tentative long off the 10390 is probably worth trying, but the stronger support at 10360 looks likely to hold if tested. As its Friday we may well get a bit of a range day, with the daily pivot at 10450 and possibly the 10475 Hull MA capping any upside today.
There are a few inflation related news items out in the USA at 1330 so we may well see some chop then, and a buy the rumour sell the news pattern may well play out ahead of that, up towards the 6880 resistance level on the S&P500. That will likely help the FTSE100 bulls drive the price up initially towards the daily pivot as well.
If the bulls were to break above the 10475 then I am looking for a test of the key fib at the 10518 level, and 10527 R1. That may well be a big ask for a Friday, given that the markets are still getting spooked quite easily as we saw yesterday. The S&P500 however will be keen to try and recapture the 7000 level before too long. That said the daily charts for the US markets have now got bearish EMAs with 25270 NASDAQ and 6907 S&P500 as resistance.
Back to the FTSE100 and if the bears were to break below the 10360 level then look out for 10310 below that as we have the bottom of the 10d Raff channel here.
Good luck today and have a great weekend.
Interested in how to start trading the FTSE 100? Frequently Asked Questions on Spread betting
Recommended Broker for trading - MT4/5, web and mobile

IC Markets - offers market leading pricing and trading conditions by providing clients with True ECN Connectivity; this allows you to trade on institutional grade liquidity from the world’s leading investment banks, hedge funds and dark pool liquidity execution venues. Highly recommended!
Join my Membership for Trading Tips, Support and Resistance Levels with Live Trading
If you would like more detailed analysis for FTSE 100, DAX40, Gold and the S&P500, including the trades that I am looking to take myself, then please join my active members community.
Keep up to date with new website posts, free sign up below
