
Technical analysis for 12th February 2026
FTSE100 Bias
- Bullish continuation bias
- Structure
- Price remains inside a rising channel
- Holding above 10/25 EMA stack → trend intact
- Pivot reclaimed and holding
- Bias
- Buyers still in control while above pivot
- Momentum favors continuation pushes higher
- Expect
- Dip buyers near pivot / EMA cluster
- Grind toward upper channel resistance
- Invalidation
- Clean daily acceptance below pivot + EMAs → neutralizes bullish bias
S&P500 Bias
- Bullish grind bias
- Structure
- Higher-low sequence intact
- EMAs stacked bullish
- Price stabilizing above pivot
- Bias
- Trend continuation favored
- Buyers active on dips
- Expect
- Slow grind higher
- Tests of overhead resistance bands
- Invalidation
- Acceptance below pivot + EMA stack → range/neutral shift
DAX40 Bias
- Bullish recovery / continuation bias
- Structure
- Strong rebound candle after channel support test
- EMAs flattening → turning supportive
- Pivot acting as acceptance zone
- Bias
- Buyers defending structure
- Path of least resistance = higher while pivot holds
- Expect
- Pullbacks bought
- Attempt toward channel mid / upper band
- Invalidation
- Loss of pivot + channel support → opens rotation lower
FTSE100 Intraday Roadmap
- Most likely flow:
- Early pullback → pivot defense
- → trend continuation toward R1
- → expansion attempt later session
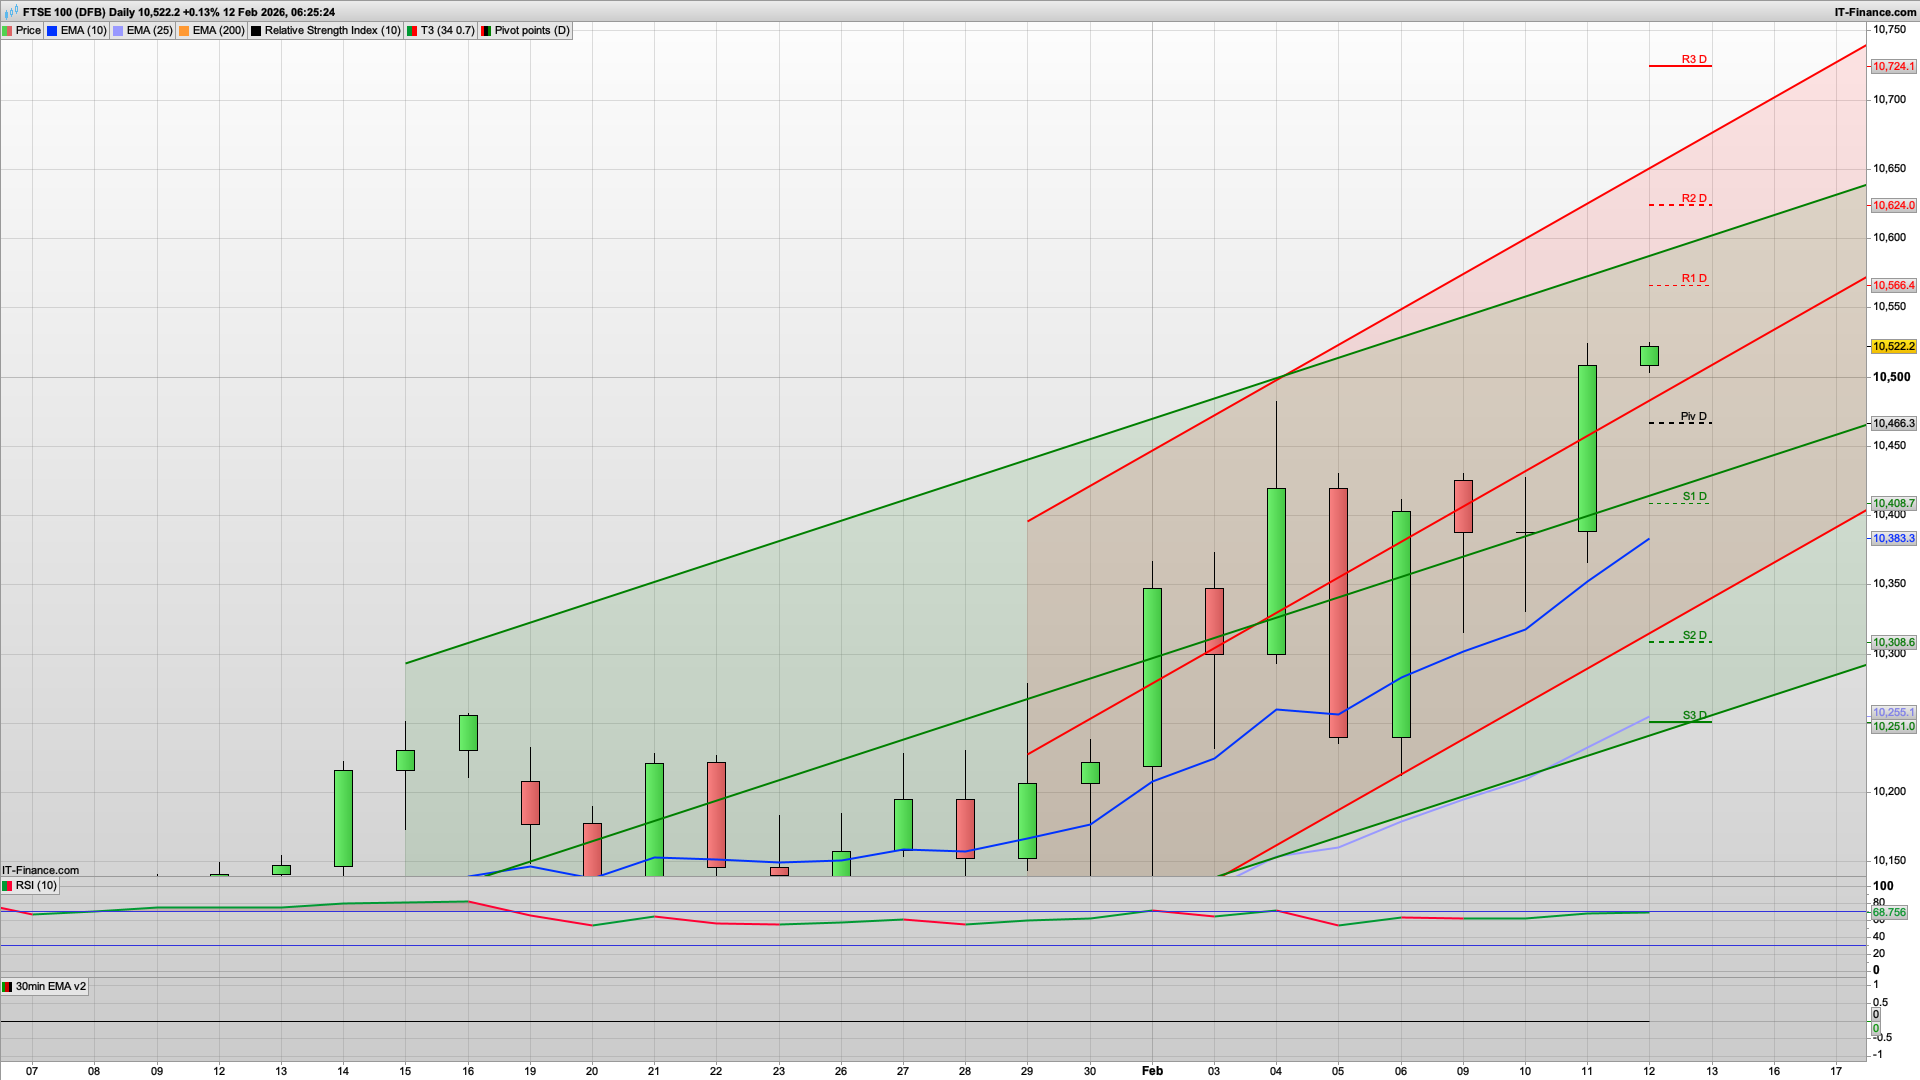
Today’s Prediction
- Highest probability scenario:
- Dip → buy response → push toward
- 10,566 → 10,624
- Only downside if pivot fails.
The bulls are back in charge and we look likely to push up towards the 10600 level today, and a possible test of the 10624 R2 level, if they can break 10566. The top of the 20d Raff channel is at 10585 also, so there are a couple of major hurdles on the way to the 10600 level. The 2h chart is nicely bullish now, with Hull MA support at the 10450 level so if the bears were to drive it down initially to target the daily pivot then we have decent support here.
10545 is the key fib to start with and we are in “buy the dip” mode, so if we see an initial dip from here then look to buy at the daily pivot level. Below this then the next major support is 10410 200ema and S1 level.
Britain’s economy grew by less than expected at the end of last year after the uncertainty surrounding the Budget. UK GDP expanded by 0.1pc in the final three months of 2025, which was lower than the 0.2pc that had been forecast by economists at Bloomberg. It means the economy managed meagre growth of 0.1pc in both the third and fourth quarters of 2025.
Whilst that lends weight to further rate cuts, it does show how weak the economy is. Traders will be pinning their hopes on rate cuts coming sooner rather than later once again.
The 2h chart on the S&P500 is bearish, with the 6967 level as Hull MA resistance so the bulls will need to break this initially to get a rise towards the 7000 area. With the key fib and the R1 level both around here we may well then see a dip from here on some profit taking.
It’s similar for the DAX40, with Hull MA resistance at the 25045 level along with the key fib at the 25081 level.
Generally today I am thinking that we will get a rise and dip play out.
Good luck.
Interested in how to start trading the FTSE 100? Frequently Asked Questions on Spread betting
Recommended Broker for trading – MT4/5, web and mobile

IC Markets – offers market leading pricing and trading conditions by providing clients with True ECN Connectivity; this allows you to trade on institutional grade liquidity from the world’s leading investment banks, hedge funds and dark pool liquidity execution venues. Highly recommended!
Join my Membership for Trading Tips, Support and Resistance Levels with Live Trading
If you would like more detailed analysis for FTSE 100, DAX40, Gold and the S&P500, including the trades that I am looking to take myself, then please join my active members community.
Keep up to date with new website posts, free sign up below
