
Technical analysis for 11th February 2026
FTSE100 Bias
- Bias:
- Bullish while above daily pivot
- Structure:
- Price holding above rising trend channel
- EMA structure supportive (price > EMA25 & EMA200)
- RSI holding mid-50s → no bearish momentum
- Key Levels:
- Bullish above: 10,350
- Resistance targets:
- 10,450 (R1)
- 10,520–10,550 (R2 / channel top)
- Support zone:
- 10,300–10,285 (Pivot / EMA25)
- 10,230 (S1)
- Invalidation:
- Daily acceptance below 10,285 → bias neutral → bearish toward S1/S2
S&P500 Bias
- Bias for today
- Neutral-bullish while above ~6,900
- Likely behaviour
- Mean reversion early
- Attempt to retest 6,985–7,020 resistance band
- Break above = squeeze day
- Failure = range chop
- Trade idea framework
- Buy support holds
- Trade range edges if no breakout
- Avoid mid-range entries
DAX40 Bias
- Bias:
- Neutral, turning bullish above pivot
- Structure:
- Compression inside broader descending structure
- Strong bullish reaction from lower channel support
- EMA25 flattening → decision zone
- Key Levels:
- Bullish above: 25,050
- Upside targets:
- 25,150 (R1)
- 25,270 (R2)
- Support:
- 24,950 (Pivot)
- 24,850–24,800 (S1 / channel support)
- Invalidation:
- Clean break & hold below 24,850 → bearish continuation toward 24,600
FTSE100 Intraday Roadmap
- Most likely flow:
- Open → pivot chop → test upper edge → rotate lower
- Possible breakout attempt later session
Today’s Prediction
- Highest probability path:
- Rotation between 10,285 ↔ 10,430 before directional expansion.
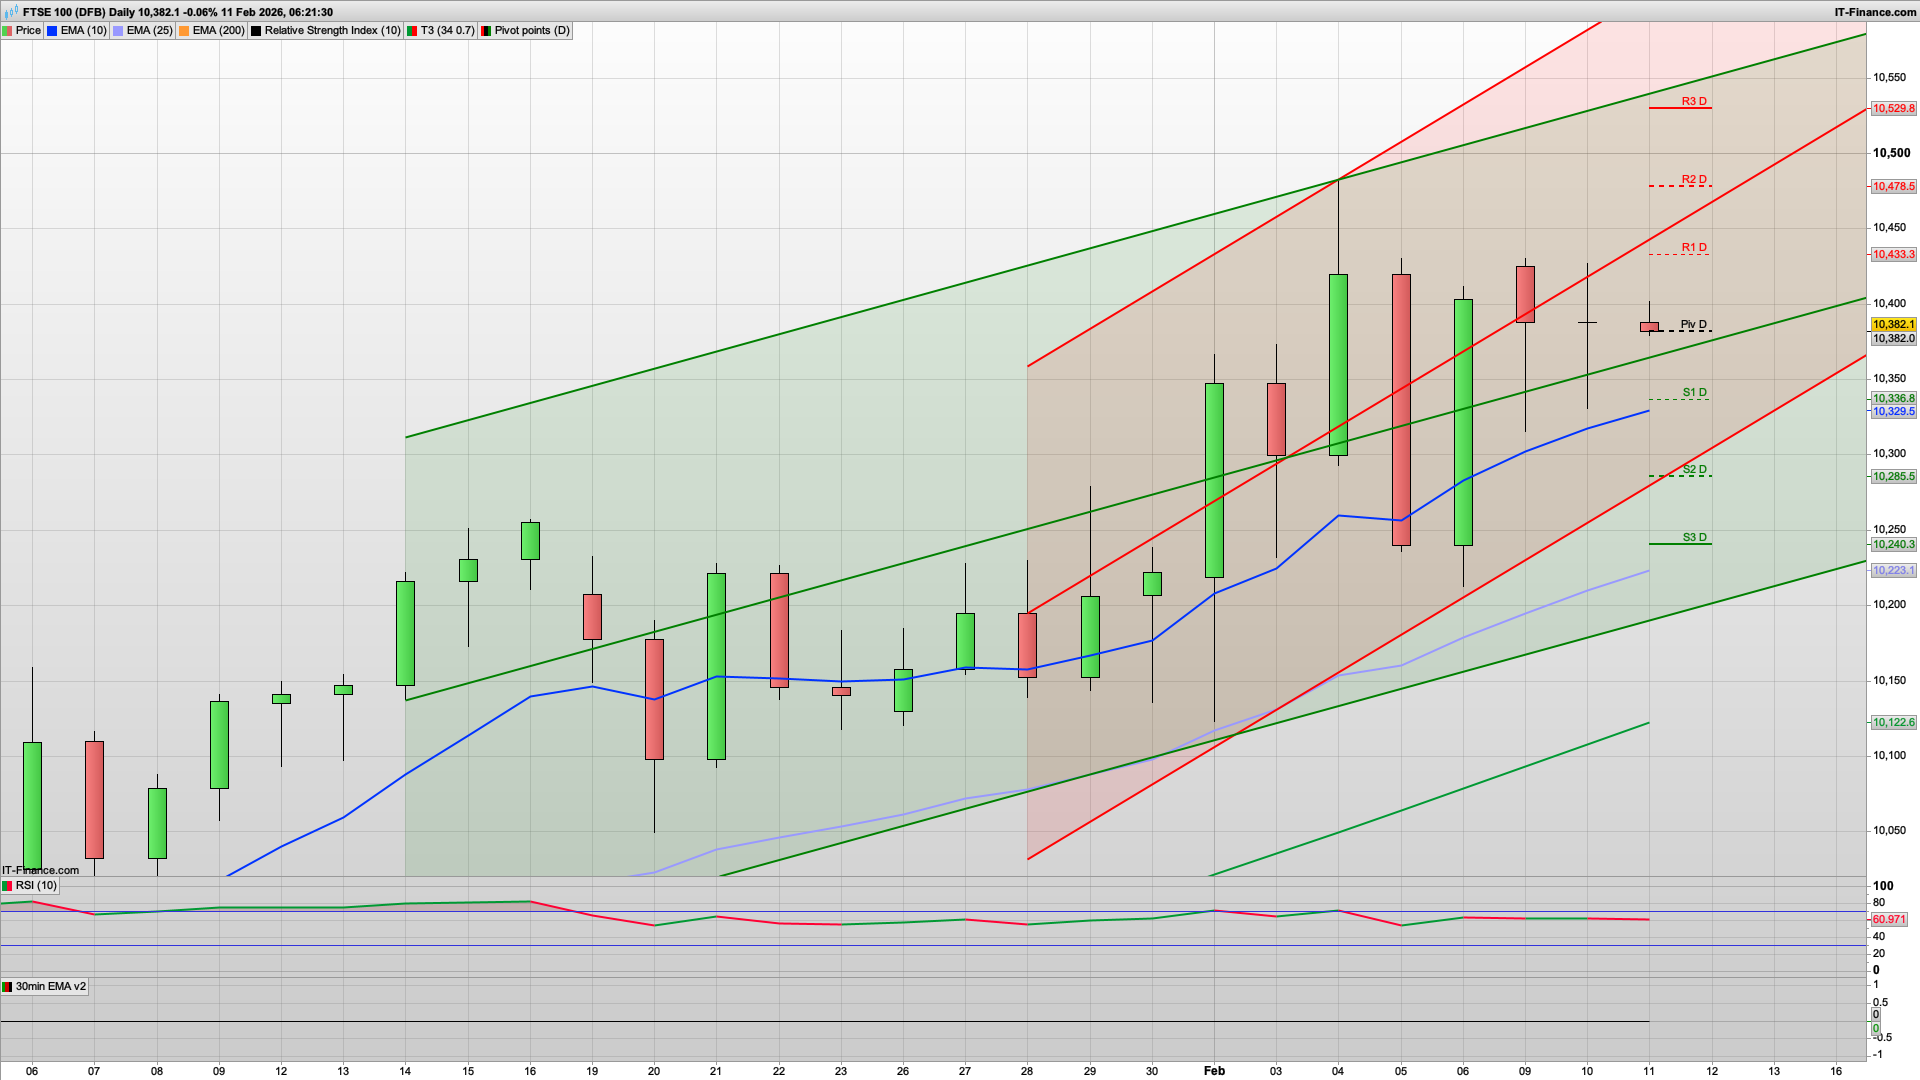
Close but no cigar to the long and short orders for the FTSE100 yesterday, however it looks like the bulls may well remain in control during todays session, if the NFP news at 1330 doesn't upset things. Initially we have support from the 30m 200ema at the 10362 level, and it would be good to see this hold for a rise towards the 10466 daily resistance level. We do have 10406 prior to that on the daily chart though, but with the move above that yesterday the bulls will be trying to hold above that today. The 10466 area looks like it may well cap things today if seen, as we have the 10478 R2 in play here as well, and the bears will be looking for their opportunity.
Above this then 10529 is R3, and if the bulls were to break 10500 then this bullish run should continue for a while longer.
Support wise, then the 103670 200ema as mentioned, but if the bears were to break below this then 10317 is the key fib support that is likely to be seen with S2 and the bottom of the 10d Raff channel at 10285 below that. Generally today I am inclined to go with a rise towards those upper resistance levels.
The 2h charts on the FTSE100, DAX40 and S&P500 are all bullish at the moment which bodes well for the bulls to continue pushing for the time being. Still in buy the dip mode!
Good luck today.
Interested in how to start trading the FTSE 100? Frequently Asked Questions on Spread betting
Recommended Broker for trading - MT4/5, web and mobile

IC Markets - offers market leading pricing and trading conditions by providing clients with True ECN Connectivity; this allows you to trade on institutional grade liquidity from the world’s leading investment banks, hedge funds and dark pool liquidity execution venues. Highly recommended!
Join my Membership for Trading Tips, Support and Resistance Levels with Live Trading
If you would like more detailed analysis for FTSE 100, DAX40, Gold and the S&P500, including the trades that I am looking to take myself, then please join my active members community.
Keep up to date with new website posts, free sign up below
