
Technical analysis for 7th August 2026
US Non-Farm Payrolls are the main event today, while renewed concerns over Iran and the Strait of Hormuz have pushed oil higher again. Markets are pricing roughly a 54% chance of a Fed rate rise next month, so the payroll number could materially change the rates outlook. European futures are slightly softer, while US futures are broadly flat ahead of the data.
We finish the week with what could easily be the most important trading session of the last few days.
Today is all about the US jobs report. After several sessions of mixed employment data, we finally get July's Non-Farm Payrolls this afternoon, and the result could have a major influence on what the Federal Reserve does next. The consensus is looking for around 80,000 new jobs, with unemployment expected to remain around 4.2%.
That doesn't sound particularly dramatic, but the range of forecasts is unusually wide. The market is currently pricing roughly a 54% chance of the Federal Reserve raising rates next month. A strong jobs report could push those expectations considerably higher. A weak report could do exactly the opposite.
At the same time, the Middle East has moved back onto the radar. Oil prices have risen again after Iran warned Gulf states over the latest US position and uncertainty returned around the Strait of Hormuz. Brent crude has moved back towards the mid-$80 area after rising sharply yesterday.
That means the market is once again dealing with the combination of higher oil, inflation concerns and uncertainty over interest rates.
We could easily see relatively quiet trading this morning followed by a major increase in volatility when the US jobs numbers arrive.
The broader trend remains bullish across most markets, but the character has changed slightly. The indices are consolidating after their recent advances, while Gold continues to show the cleanest upside momentum.
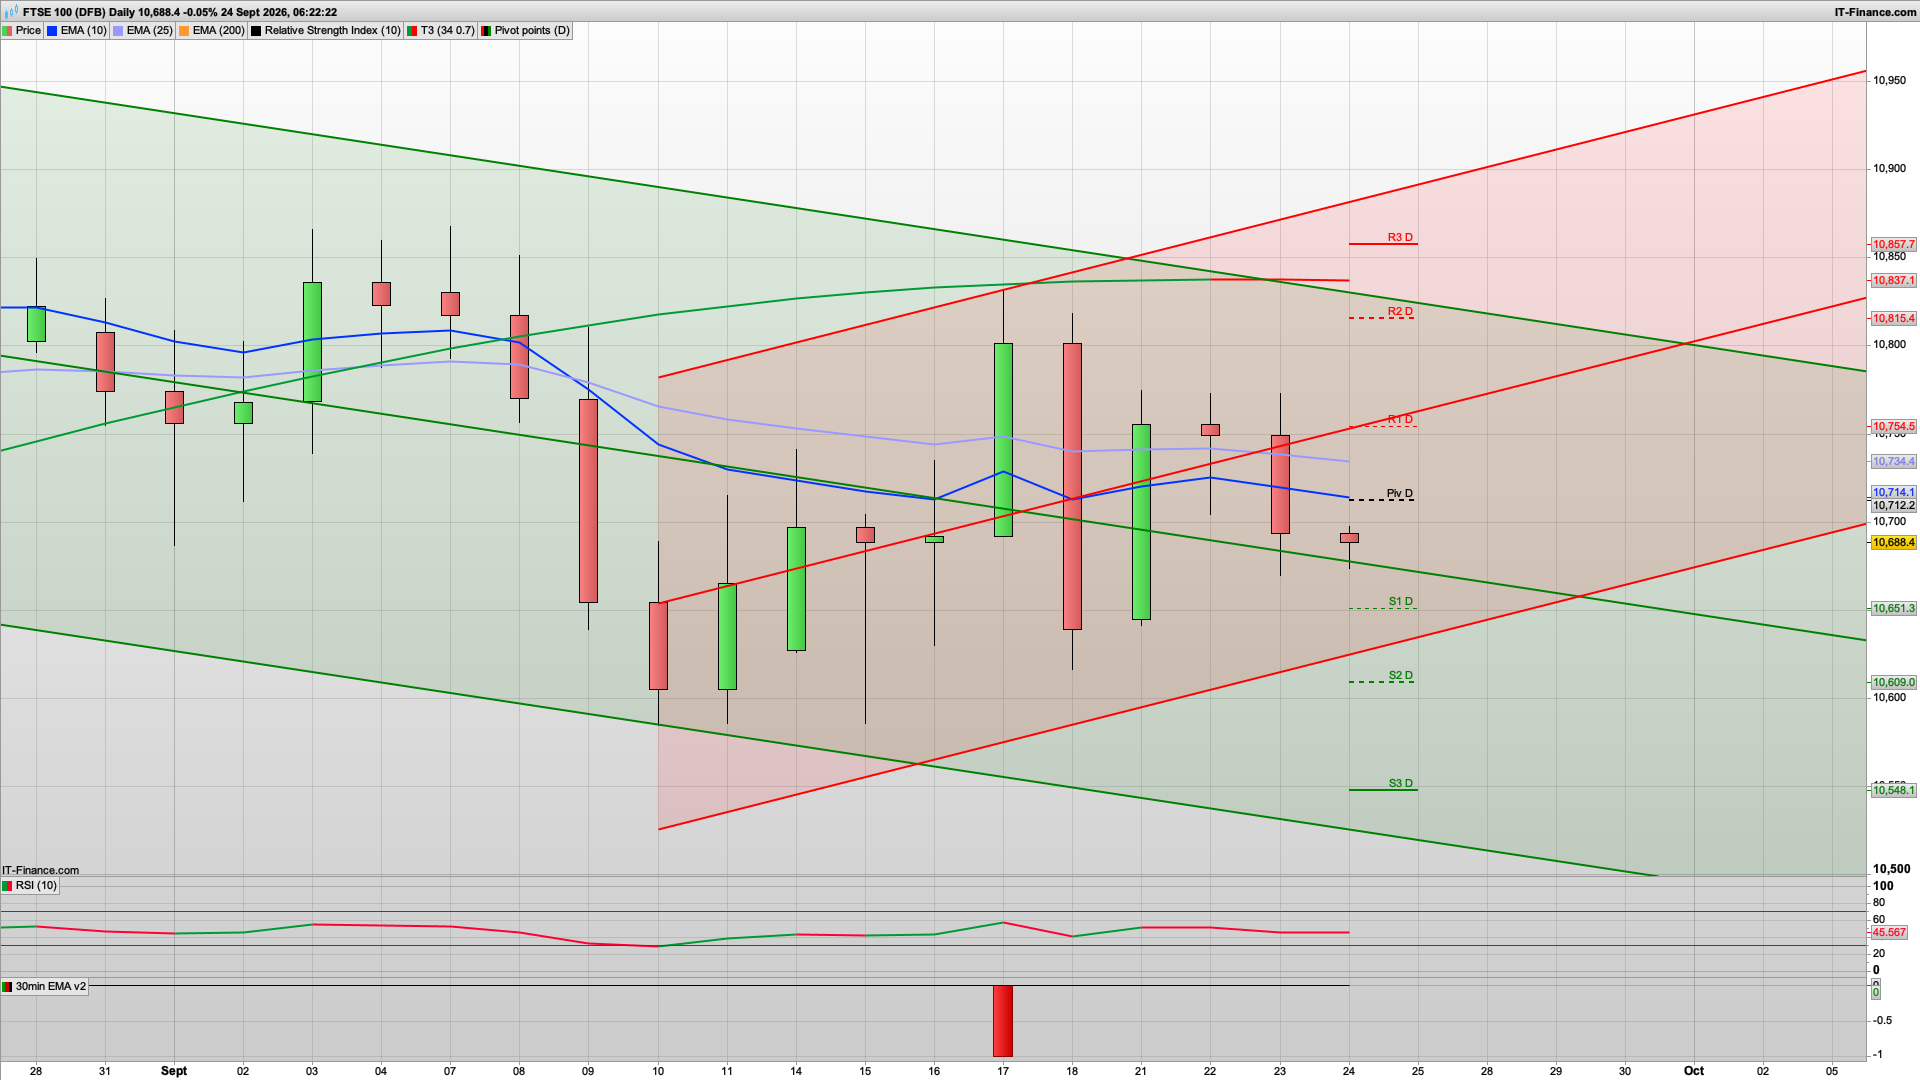
FTSE 100 - Neutral to Bullish
- The FTSE remains in its broader rising trend, but the short-term momentum has clearly softened.
- We've now seen several sessions struggling around 10,900 - 10,950, and today's price around 10,859 is below the 10,886 pivot.
- That's enough for me to downgrade the FTSE slightly from yesterday's outright bullish stance.
- However, the rising 10 EMA around 10,839 is immediately underneath price.
- That creates an interesting support cluster.
- Rather than buying immediately, I'd watch 10,830.
- If the FTSE tests 10,830–10,800 and buyers appear, I'd favour longs back towards 10,885 → 10,922 → 10,980.
- A clean break below 10,793, however, would suggest the pullback has further to run.
- Bias: NEUTRAL/BULLISH - buy support rather than strength.
DAX 40 - Bullish
- The DAX has now had several sessions of consolidation/pullback after the strong rally into 26,400, but importantly the underlying rising structure has not broken.
- Price is sitting almost directly on the 26,172 daily pivot, while the rising trend support is also coming into this area. That makes the current 26,080–26,170 region particularly important.
- RSI around 67 remains positive without being excessively stretched.
- Today's plan: I favour buying weakness into 26,170–26,080, preferably after seeing buyers defend the area.
- A sustained break below 26,080 would weaken the immediate bullish case and expose 25,995/25,900.
- Bias: BUY THE DIP.
S&P 500 - Bullish
- The S&P remains technically strong.
- Price is consolidating around the daily pivot after the sharp rally earlier this week and remains comfortably above the rising 10 and 25 EMAs.
- The current structure looks much more like bullish consolidation than distribution.
- This creates quite a clean setup.
- I'd favour buying a test of approximately 7,715 - 7,685, looking for the rising channel to remain intact.
- A push through 7,733 would strengthen the case for 7,760+, and beyond that the next larger technical objective becomes the 7,800+ area.
- Only a sustained loss of approximately 7,640 would materially change my near-term view.
- Bias: BUY THE DIP.
Nasdaq 100 - Neutral to Bullish
- This remains the most complicated of the US equity charts.
- The recovery from the late-July lows has been strong, but the Nasdaq has stalled underneath the descending higher-timeframe resistance line around 29,900–30,000.
- At the same time, price remains above the rising 10/25 EMAs, so I wouldn't become outright bearish yet.
- The 29,355 pivot is today's first important line in the sand.
- For longs, I would prefer to see 29,350 hold and then price reclaim 29,590. That would reopen 29,800 and potentially the psychologically important 30,000 area.
- Conversely, losing 29,350 could trigger another test of 29,140, with the EMA cluster around 28,900–29,000 becoming the more attractive buy area.
- Bias: CAUTIOUSLY BULLISH — don't chase.
Gold - Strong Bullish
- Gold remains my strongest chart today.
- The breakout we've been following has held, and yesterday's candle effectively consolidated the huge move rather than reversing it. This morning Gold is already pushing higher again around 4,266.
- More importantly, the technical structure has changed materially.
- Price is above the rising 10 and 25 EMAs and is now testing the major 200 EMA around 4,289.
- That is today's critical resistance.
- The setup I particularly like
- If Gold pulls back into approximately 4,255–4,210 and holds, I would favour another long.
- Targets would be:
- 4,289 → 4,337 → 4,370
- Alternatively, a decisive breakout and hold above 4,290 would be significant because it would put Gold above the 200 EMA and potentially trigger another momentum leg.
- Bias: STRONG BUY THE DIP.
Interested in how to start trading the FTSE 100? Frequently Asked Questions on Spread betting
Recommended Broker for trading - MT4/5, web and mobile

IC Markets - offers market leading pricing and trading conditions by providing clients with True ECN Connectivity; this allows you to trade on institutional grade liquidity from the world’s leading investment banks, hedge funds and dark pool liquidity execution venues. Highly recommended!
Join my Membership for Trading Tips, Support and Resistance Levels with Live Trading
If you would like more detailed analysis for FTSE 100, DAX40, Gold and the S&P500, including the trades that I am looking to take myself, then please join my active members community.
Keep up to date with new website posts, free sign up below

Day trading for beginners - Join today and get:
- Daily detailed analysis before the market opens
- Detailed trade plans for the FTSE100, S&P500, Dax40 and Gold
- Email updates during the day
- Live trading room open all day
- Telegram chat room groups
- Help and support