
Technical analysis for 5th May 2026
FTSE 100
- Bias: Bearish
- Clean downtrend channel intact
- Lower highs + below EMAs
- Weak bounce only
- Plan
- Sell rallies:
- 10,300–10,400
- Targets:
- 10,150 → 10,050
- Sell rallies:
- One of the weaker indices
DAX40
- Bias: Bearish (range breakdown / weak structure)
- Price rejected mid-channel + pivot (~24,050–24,100)
- Lower highs still intact
- Sitting below short-term MAs
- Plan
- Sell rallies:
- 24,050–24,200
- Targets:
- 23,700 → 23,500
- Sell rallies:
- No strong bullish structure yet — rallies likely sold
NASDAQ
- Bias: Neutral → Slight Bullish
- Still in uptrend channel
- BUT:
- Losing momentum (small candles / indecision)
- Sitting around pivot (~27,680)
- Plan
- Buy dips ONLY if holds:
- 27,500–27,300
- If pivot fails → short pullback
- Buy dips ONLY if holds:
- Market pausing, not trending strongly today
S&P 500
- Bias: Neutral
- Same as NASDAQ:
- Uptrend intact structurally
- But momentum fading
- Price sitting on pivot (~7,210)
- Plan
- Wait for direction:
- Above 7,250 → bullish continuation
- Below 7,180 → pullback lower
- Wait for direction:
- No edge in the middle — patience market
GOLD
- Bias: Bearish (continuation)
- Strong downtrend channel still respected
- Lower highs + below all MAs
- Small bounce = corrective only
- Plan
- Sell rallies:
- 4,560–4,620
- Targets:
- 4,480 → 4,350
- Sell rallies:
- Trend still clearly down
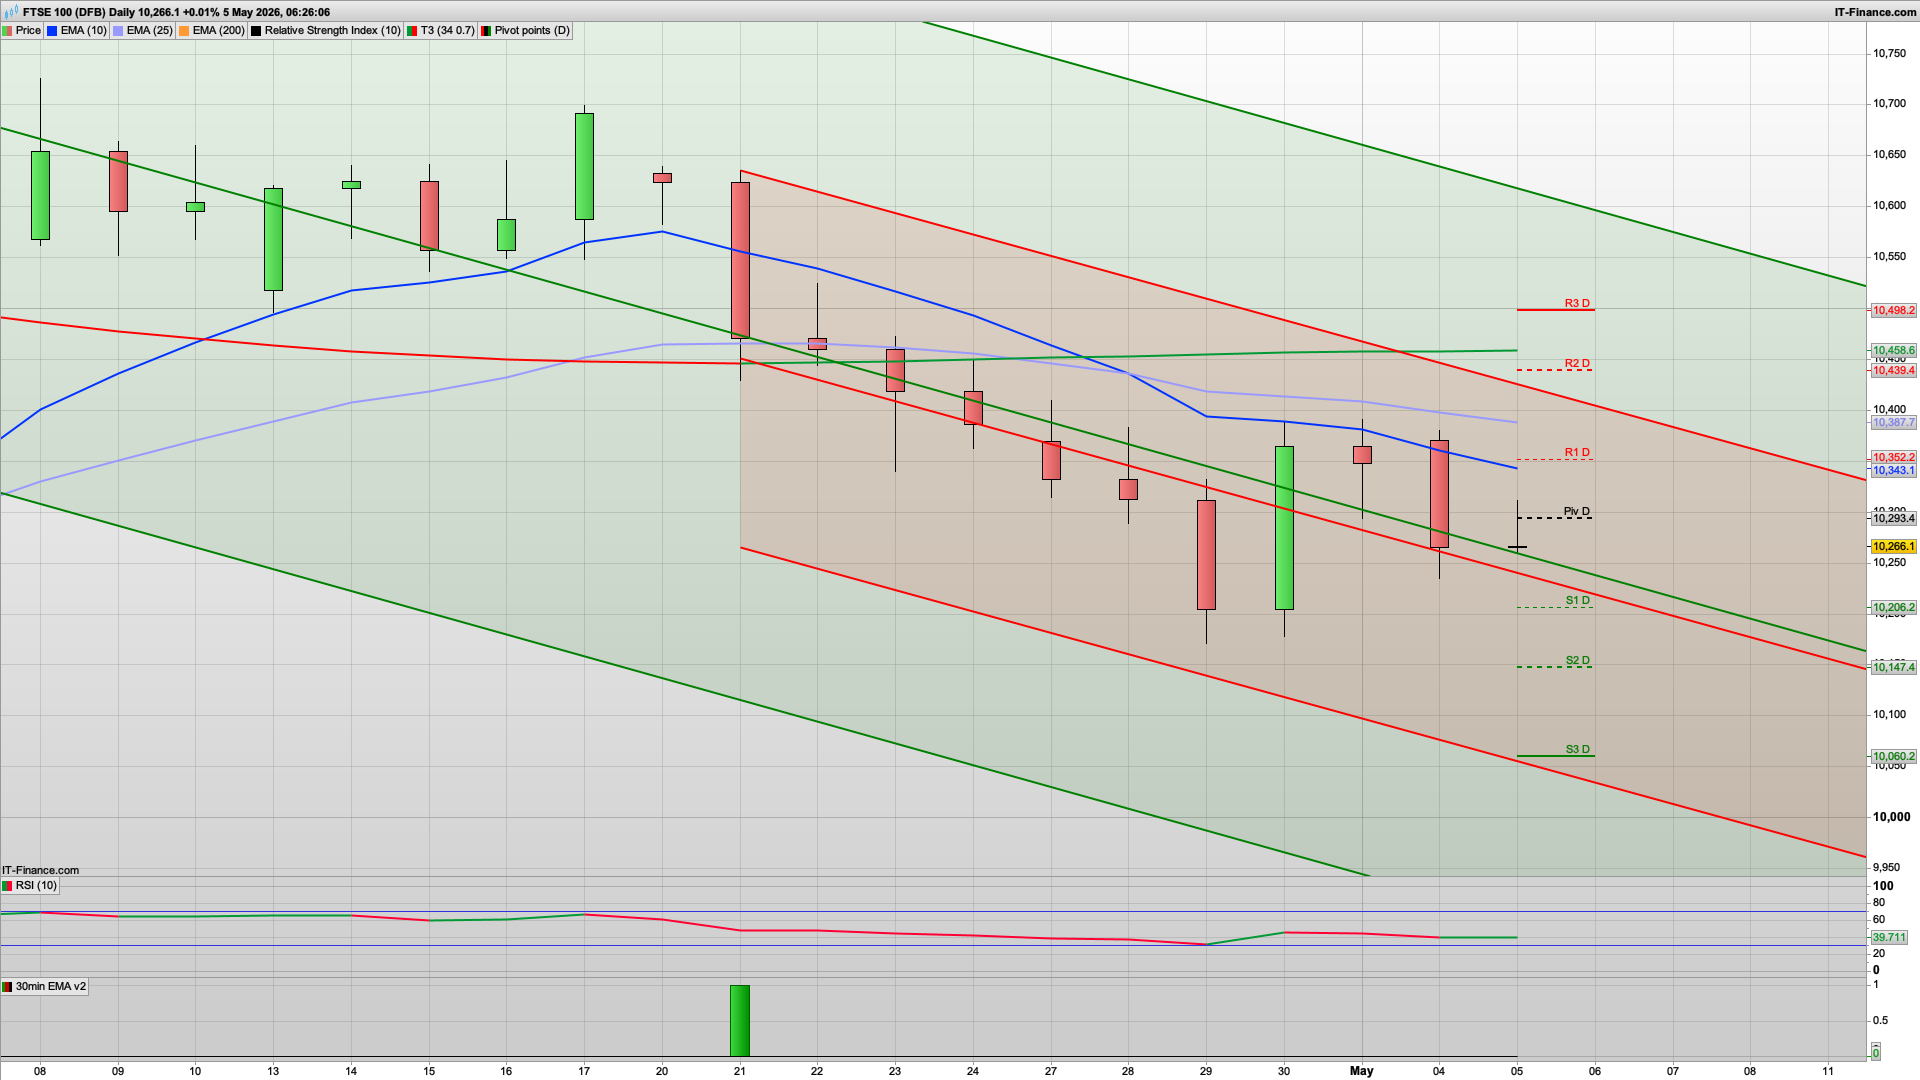
We didn't get much of a bull Monday yesterday as Middle East tensions are still at the fore, though calmed down a bit today as oil has dropped back slightly. The FTSE100 initially held the 10275 support level yesterday but the break of that saw a test of 10235 - that is the lower daily support for the moment now.
Just below this however we have decent looking support at the 10210 area with S1 and the key fib here, and should we see a drop down to this area then I would like to see a bounce here. Just below this the daily support level at 10187 may well be tested.
Initially it looks like it's still a short the rallies day, with the 10315 level looking key to start with. We have the Hull MA here on the 2h chart, along with the 30m 200ema. If the bulls were to break above this then look for a rise towards the 10355 area where we have the R1 and key fib for today, and a level that the bears may well try and regain control.
The S&P500 has bounced from its lows at 7170 and being back above the 7200 level may well help the bulls across the board. We do have some key news out at 1500 in the USA, namely ISM and JOLTS so expect some volatility then.
Good luck today.
Interested in how to start trading the FTSE 100? Frequently Asked Questions on Spread betting
Recommended Broker for trading - MT4/5, web and mobile

IC Markets - offers market leading pricing and trading conditions by providing clients with True ECN Connectivity; this allows you to trade on institutional grade liquidity from the world’s leading investment banks, hedge funds and dark pool liquidity execution venues. Highly recommended!
Join my Membership for Trading Tips, Support and Resistance Levels with Live Trading
If you would like more detailed analysis for FTSE 100, DAX40, Gold and the S&P500, including the trades that I am looking to take myself, then please join my active members community.
Keep up to date with new website posts, free sign up below
