
Technical analysis for 10th April 2026
FTSE 100 — Neutral / pullback
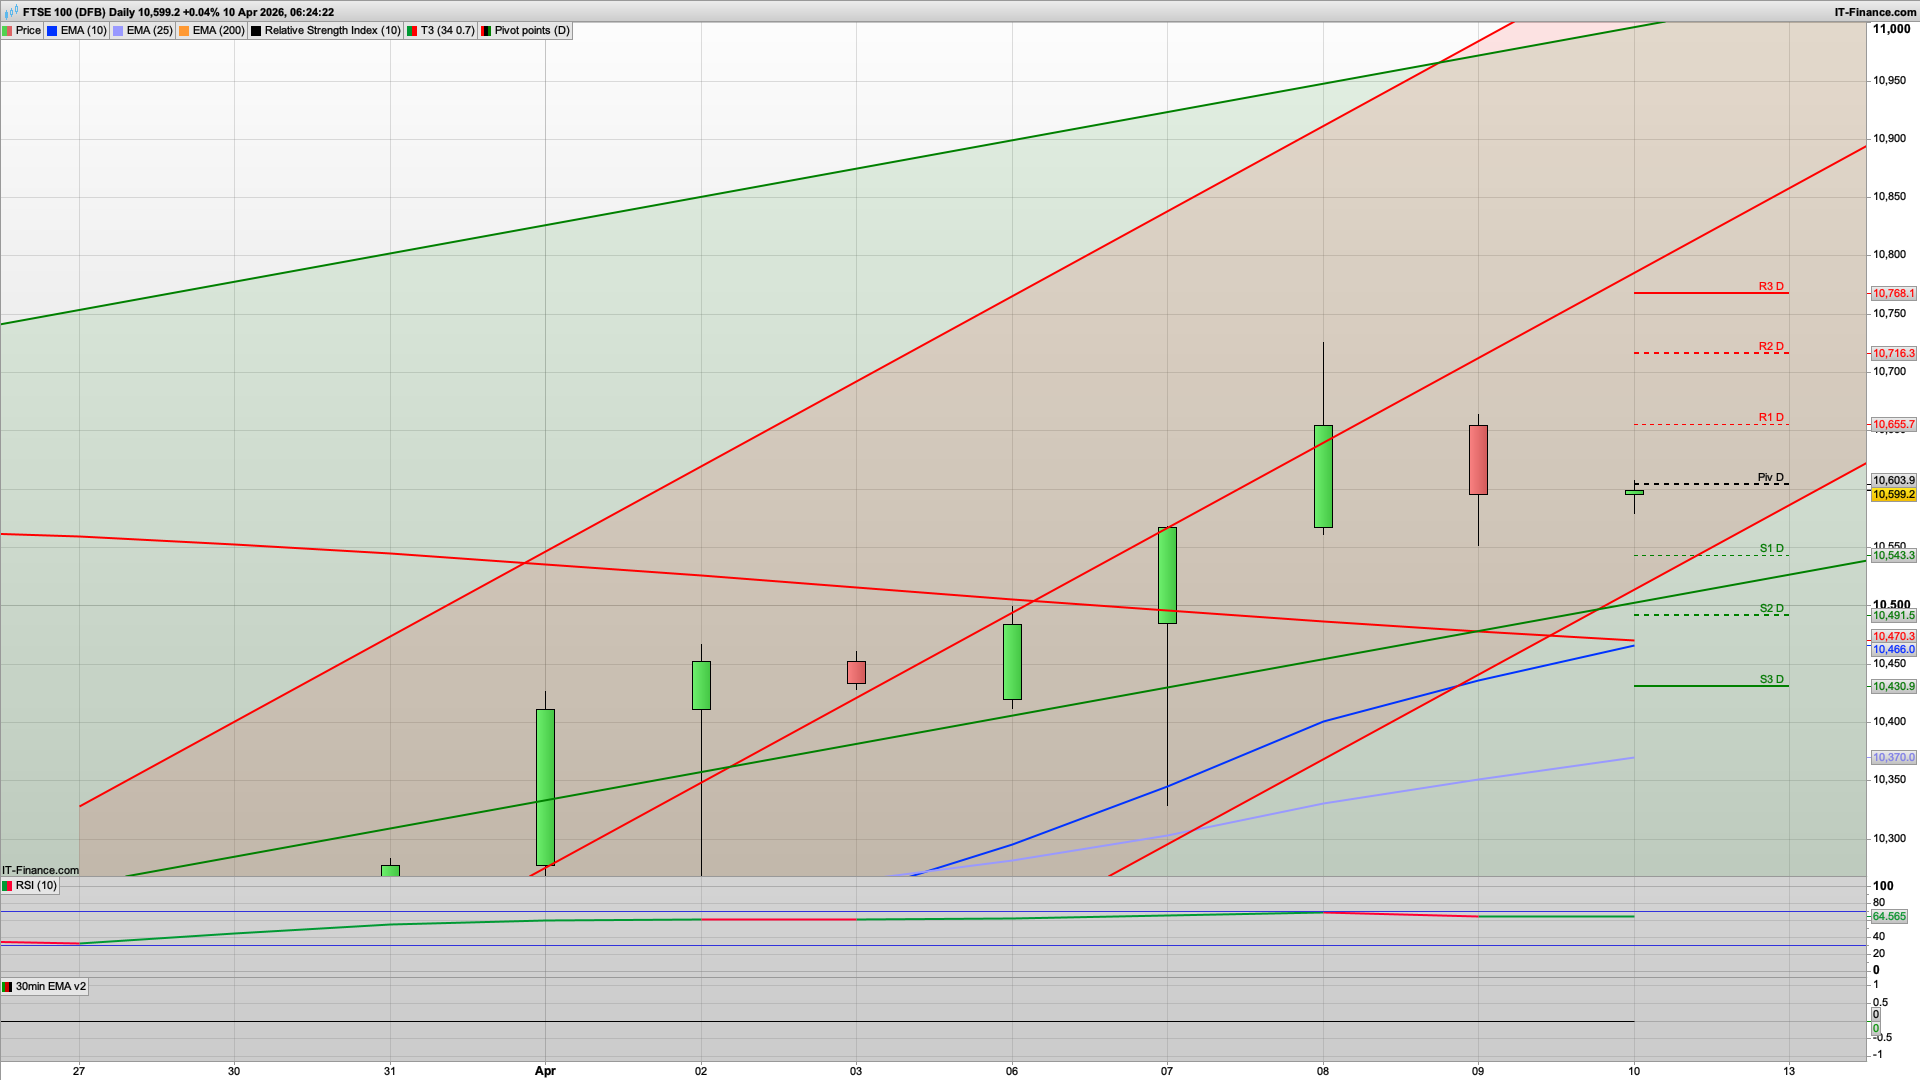
- Clear rejection candle yesterday
- Now sitting right on pivot
- More downside pressure vs US
- Bias:
- Sell rallies OR wait for reclaim of pivot
- Weakest index today
DAX — Neutral → slight bullish
- What changed
- Small inside / indecision candle at pivot
- Holding trend channel support
- No breakdown yet
- Bias:
- Range / chop likely early
- Lean buy dips IF pivot holds
- Lose pivot = quick move lower into S1
NASDAQ — Bullish continuation (strongest)
- Strong structure, higher highs intact
- Holding above pivot comfortably
- No real rejection yet
- Bias: Buy dips
- Still leading the market
S&P 500 — Bullish but slowing
- Trend intact
- But momentum flattening
- Smaller candles = hesitation
- Bias:
- Buy dips, but expect slower grind
- Not a breakout day
GOLD — Neutral (range)
- Choppy inside channel
- No strong follow-through either way
- Sitting around pivot
- Bias:
- Range trading
- Sell highs / buy lows until breakout
A decent bounce that surpassed the 10600 level yesterday and the bulls will be looking to build on that today and try and close the week above 10600. With the daily pivot also here its the key level for today - bullish above, bearish below - and we may well see a break higher later with a dip and rise playing out today.
If they do manage to get above 10600 then I am looking for a test of the 10670 are where we have the key fib and just above 10655 R1. The longer timeframes such as the daily are still bullish, with the EMAs confirmed bullish now, and 10370 support on that. However the 2h chart is bearish initially and has 10644 as Hull MA resistance - it was this Hull MA that we dropped off yesterday at 10635.
If the bulls were able to break above 10670 then we also have the daily resistance at 10688 which looks pretty key and will be worth a short ahead of the weekend - some likely profit taking later in case the Middle East flares up again, and its all still on shaky ground.
Support wise, if we do get an initial dip then I am looking at the 10540 area to hold, as we have a cluster of supports here - S1, key fib and the 30m 200ema. A decent bounce from this area would be good otherwise we may well see a slide down to the 10491 S2 level.
We have a load of USA inflation data out at 1330 today with forecasts predicting an uptick across the board so expect some chop at this time.
Good luck today and have a great weekend.
Interested in how to start trading the FTSE 100? Frequently Asked Questions on Spread betting
Recommended Broker for trading - MT4/5, web and mobile

IC Markets - offers market leading pricing and trading conditions by providing clients with True ECN Connectivity; this allows you to trade on institutional grade liquidity from the world’s leading investment banks, hedge funds and dark pool liquidity execution venues. Highly recommended!
Join my Membership for Trading Tips, Support and Resistance Levels with Live Trading
If you would like more detailed analysis for FTSE 100, DAX40, Gold and the S&P500, including the trades that I am looking to take myself, then please join my active members community.
Keep up to date with new website posts, free sign up below
