
Technical analysis for 9th April 2026
FTSE 100 — Bullish but extended
- Strong trend continuation
- Multiple consecutive higher closes
- Small pause candle forming
- Bias: Buy dips only
- Do NOT chase highs
DAX — Bullish → slowing
- Still inside rising channel
- Holding above pivot & EMAs
- Small red candle after strong push (pause, not reversal)
- Bias: Buy dips (but less aggressive)
- Expect shallow pullbacks / consolidation first
NASDAQ — Bullish (but stalling at highs)
- Strong breakout candle yesterday
- Today = small rejection near highs
- Sitting just above pivot
- Bias: Buy dips, but:
- Market likely pauses before next leg
- Avoid chasing highs
S&P 500 — Bullish continuation
- Strong structure intact
- Holding above pivot cleanly
- No real rejection yet
- Bias: Buy dips (cleanest US index today)
GOLD — Neutral → Bearish bias
- Weak bounce vs equities strength
- Still below key resistance zone
- Lacking momentum compared to indices
- Bias: Sell rallies
- Especially if indices stay bid
Overall market read
- Indices = bullish trend intact
- BUT:
- We are now in a pause / digestion phase after breakout
- This is important because:
- Momentum slows
- Pullbacks become more likely
- Fake breakouts increase
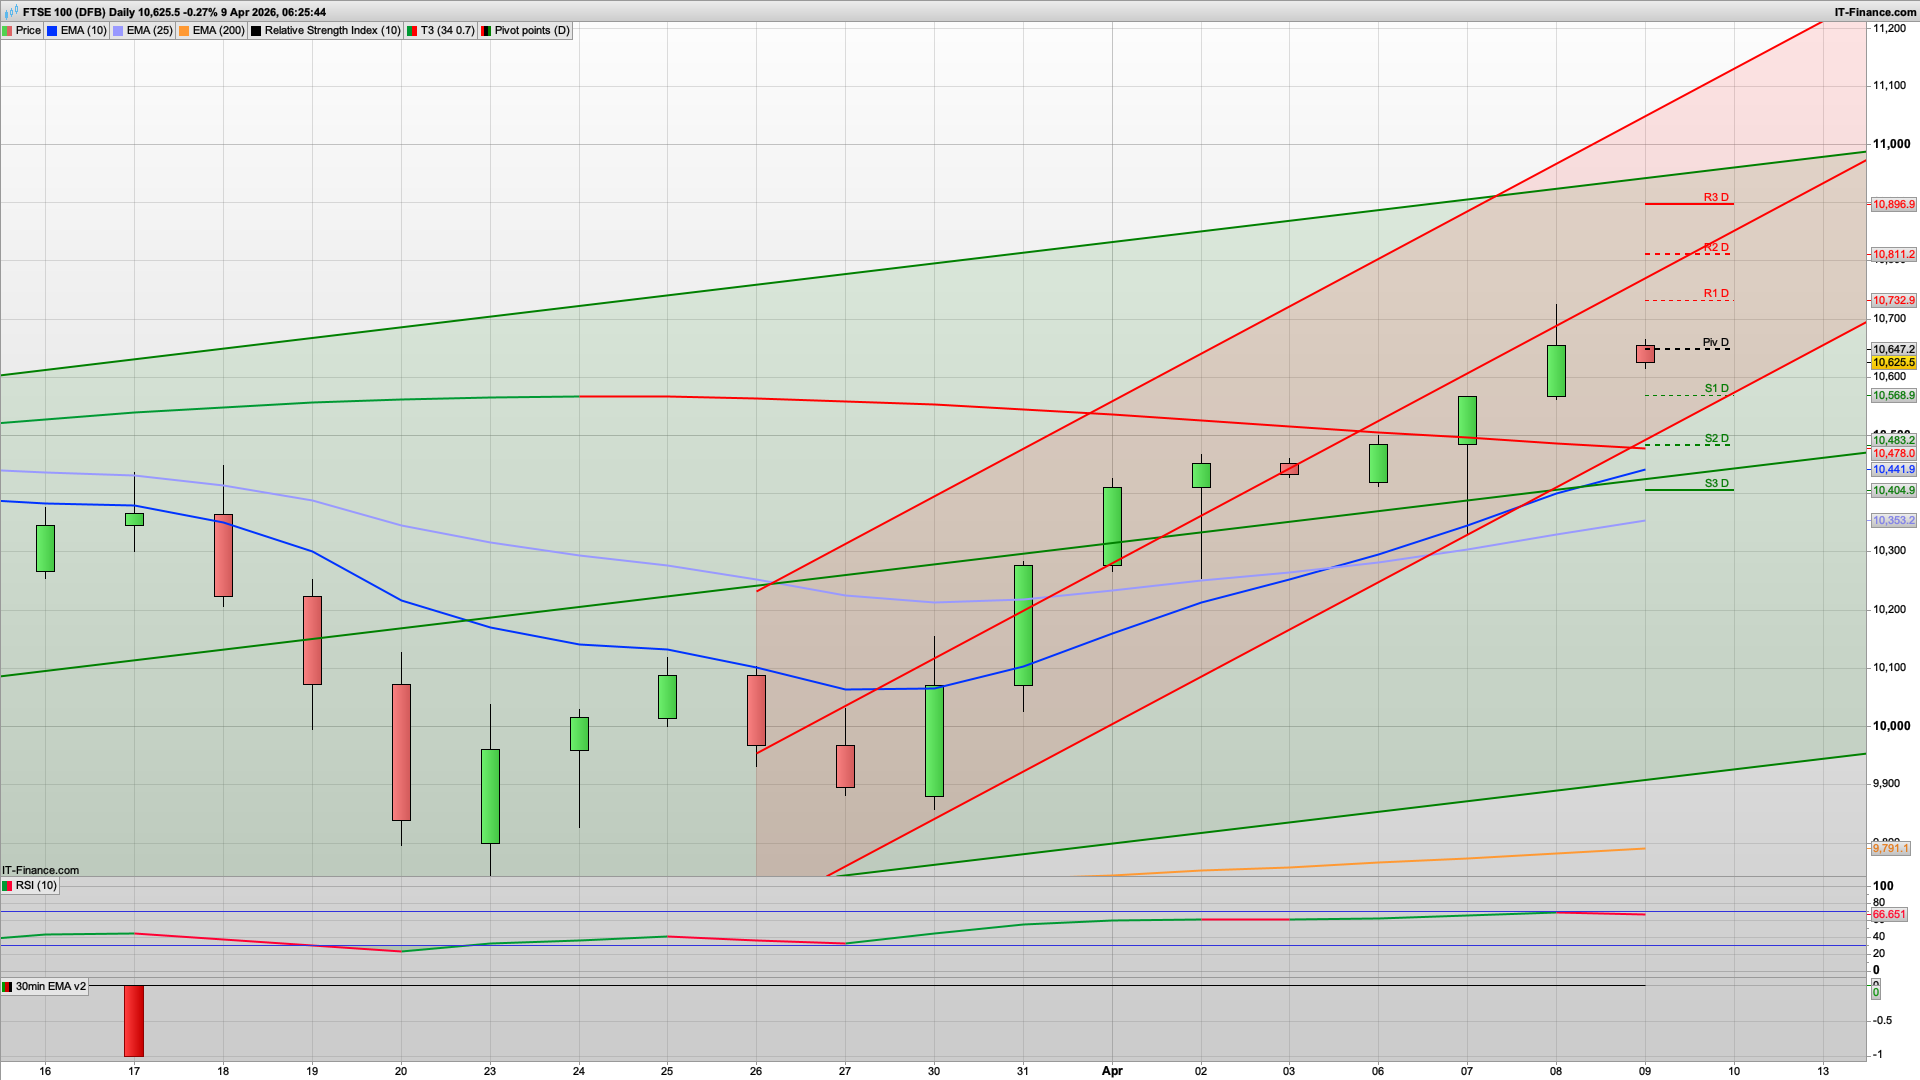
The bulls hung in there yesterday and we only got as low as the first major support at 10580. That remains the line in the sand as support and is also the key fib for today, and just above S1 at 10569 so any dip down to this area is still a buy. The ceasefire remains fragile for the moment but markets are proving quite resilient still, and the general bias remains bullish for indices. Oil remains elevated and has ticked up a little bit so far today (still helping BP and Shell!)
The FTSE100 may well rise to test the 10732 resistance level and with R1 and the key fib here then I am liking a short at this level. If we get a decent break above this level then it will be worth longing as the bulls will likely try and take it up towards the 10811 R2 level. We still also have that daily resistance level at 10934.
If the bears were to break below 10580 then 10505 is the 30m 200ema and just above R2 at 10483 so we may well see this area hold. The Raff channels continue to head upwards as well and the bottom of the 10d channel is at 10500 also - along with the daily coral here - albeit still red and not locked in as bullish. I am more inclined to go with the 10580 holding as support if seen though today and we get a decent bounce again from that area.
There is some US news out at 1330 - inflation and GDP with the latter expected to have slowed to 0.7% from 4.4% previously so we may well see the US bears try and capitalise on this news release - which may well lead to the rise and dip playing out on the S&P500 and the R1/30m coral level at 6804 holding as resistance.
Good luck today.
Interested in how to start trading the FTSE 100? Frequently Asked Questions on Spread betting
Recommended Broker for trading - MT4/5, web and mobile

IC Markets - offers market leading pricing and trading conditions by providing clients with True ECN Connectivity; this allows you to trade on institutional grade liquidity from the world’s leading investment banks, hedge funds and dark pool liquidity execution venues. Highly recommended!
Join my Membership for Trading Tips, Support and Resistance Levels with Live Trading
If you would like more detailed analysis for FTSE 100, DAX40, Gold and the S&P500, including the trades that I am looking to take myself, then please join my active members community.
Keep up to date with new website posts, free sign up below
