
Technical analysis for 8th April 2026
A sparkling relief rally across assets will greet Europe after U.S. President Donald Trump and Iran agreed to a two-week ceasefire.
FTSE 100 — Bullish (trend leader)
- What changed
- Continuation of strong trend
- Clean higher highs + higher lows
- No real rejection yet
- Bias: Buy dips (best structure)
DAX — Bullish (breakout continuation)
- What changed
- Strong impulsive green candle
- Broke above pivot + channel resistance
- Holding above key moving averages
- Read: Trend flipped short-term bullish
- Bias: Buy dips
- Especially into pivot / EMA support
NASDAQ — Bullish (early breakout)
- What changed
- Strong breakout candle through resistance
- Holding above pivot
- Structure shifting from base → trend
- Read: Beginning of short squeeze phase
- Bias: Buy dips
S&P 500 — Bullish (strong momentum)
- What changed
- Large impulsive move up
- Clean break above range + pivot
- Strong follow-through potential
- Bias: Buy dips / momentum continuation
GOLD — Neutral → Bearish bias
- What changed
- Rally stalling into resistance
- Small rejection forming
- Still below key higher timeframe resistance
- Read: Likely lagging risk-on move
- Bias:
- Below pivot → Sell rallies
- Needs breakout to flip
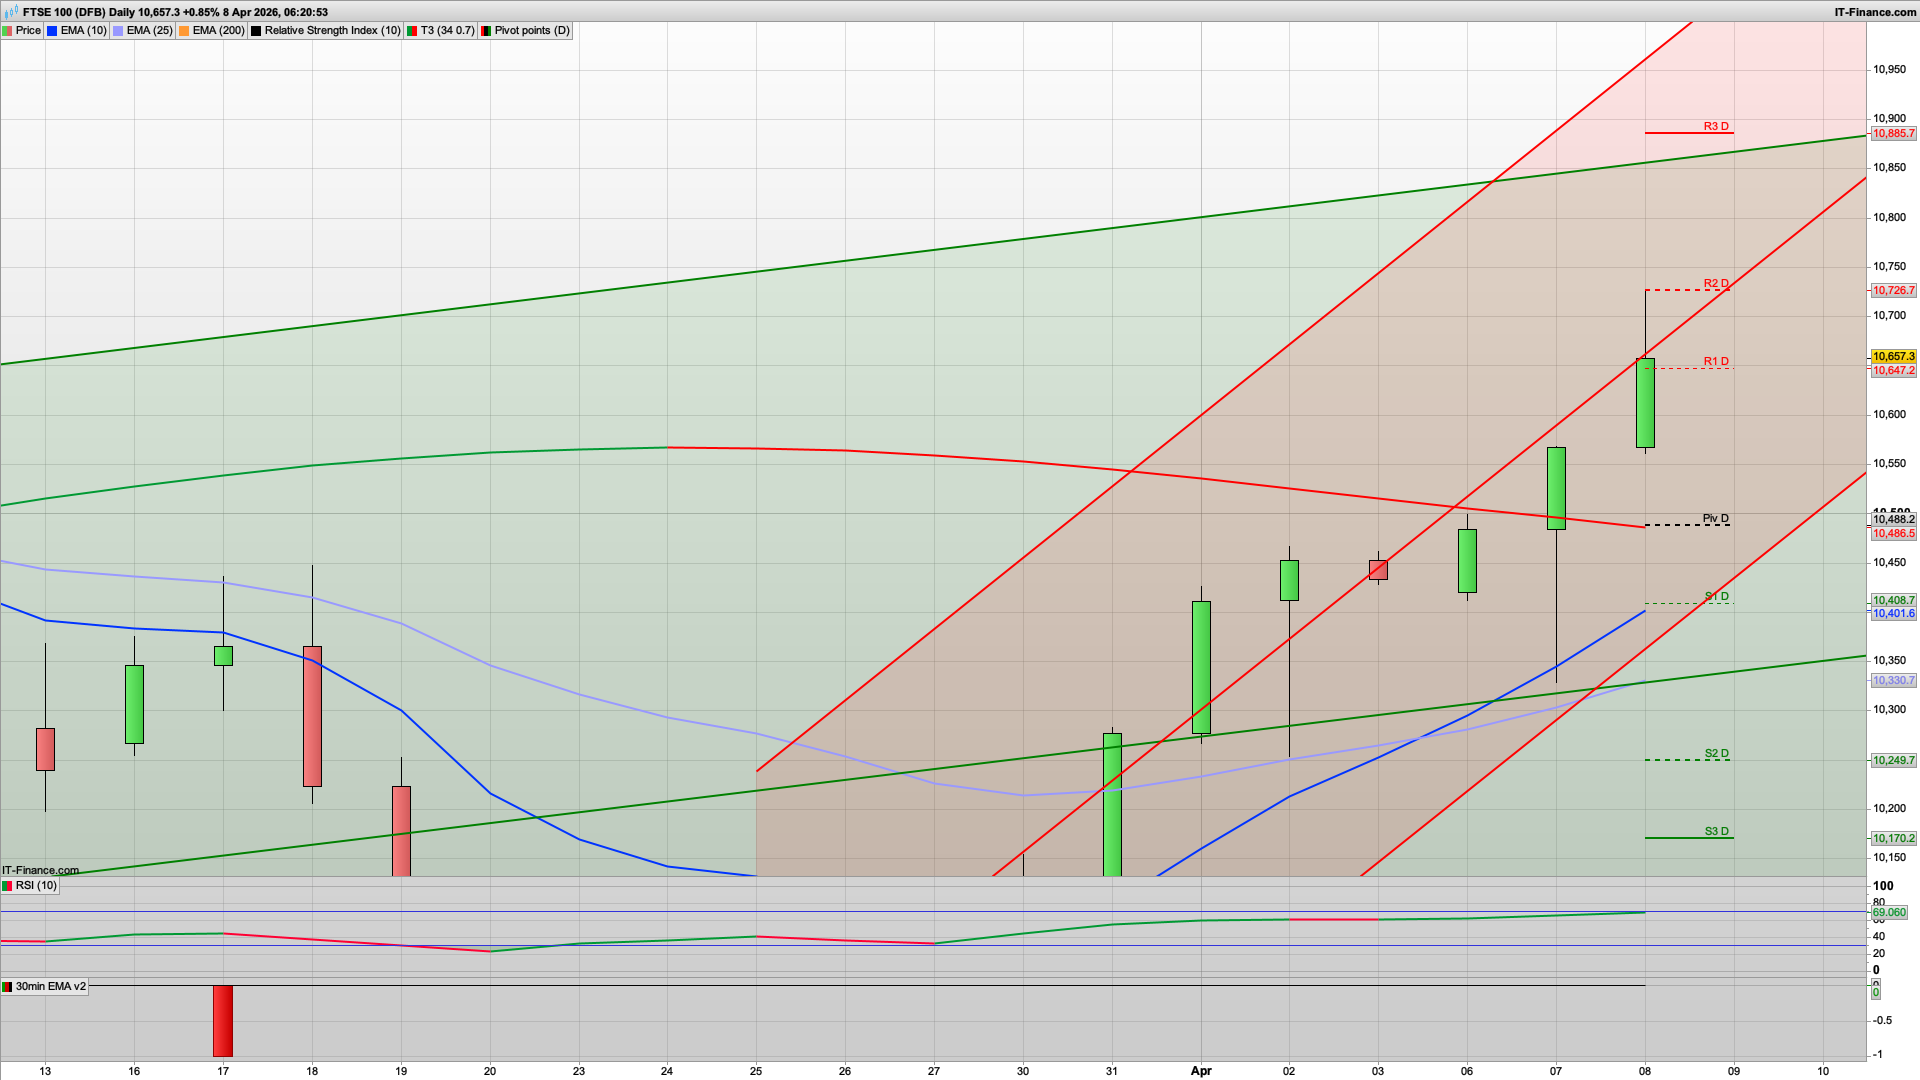
Yesterday's bullish structure within the ascending channel was the precursor to the overnight rises following the news of the 2 week ceasefire - markets have collectively shot up and we are now firmly into buy the dip and long the breakouts. For today I am looking at key support at the 10550-10570 area which is the Hull MA on the 2h chart and a backtest of the key fib. For the resistance level, and ergo key breakout level, I am looking at the 10726 R2 level - if we get a decent break of this then its worth longing as we still have the 10934 daily resistance level in play - explains why that level popped up yesterday - which is the recent all time high.
This is a clear shift again versus yesterday — we’ve moved from mixed / consolidation → risk-on breakout structure.
- Key shift (very important)
- Yesterday → indecision / range
- Today → broad risk-on breakout across indices
- This is where:
- Shorts get squeezed
- Pullbacks get bought
- Momentum trades perform best
The Raff channels are both heading upwards now on the FTSE100 and for once this market is the leader - it went bullish earlier than the others (helped of course by oil's rise past $100) and after that hold of the 9670 level, and a test of the 10934 looks likely.
If the bears were to break belle the 10550 level then the daily pivot is the next key support and is likely to hold at 10488 so also worth a long here if seen. This is helped by the green 30m coral which is rising to meet that area as well. With the daily chart now firmly locked in bullish mode, we still have lower support from the 25ema at 10330 so any drop down to this line in the next several sessions is also a long.
Similar for the S&P500 and the DAX40 with a potential dip down to the supports and then a rise. We may well see some profit taking to trigger the initial dip from the speculative longs from yesterday and then some more sustained buying later. I am looking at 6700 and 23700 as the main support levels on these two markets.
Good luck today.
Interested in how to start trading the FTSE 100? Frequently Asked Questions on Spread betting
Recommended Broker for trading - MT4/5, web and mobile

IC Markets - offers market leading pricing and trading conditions by providing clients with True ECN Connectivity; this allows you to trade on institutional grade liquidity from the world’s leading investment banks, hedge funds and dark pool liquidity execution venues. Highly recommended!
Join my Membership for Trading Tips, Support and Resistance Levels with Live Trading
If you would like more detailed analysis for FTSE 100, DAX40, Gold and the S&P500, including the trades that I am looking to take myself, then please join my active members community.
Keep up to date with new website posts, free sign up below
