
Technical analysis for 14th April 2026
FTSE 100 — Bearish
- What I see
- Rejection candle at highs
- Back below pivot
- Weak close vs US indices
- Bias: Sell rallies
- Same theme: Europe lagging
DAX — Neutral → Bearish bias
- What changed
- Still below pivot
- Weak follow-through after prior rejection
- Structure = lower high + pressure building
- Bias: Sell rallies (but not impulsive)
- Likely grind lower rather than dump
- Watch pivot rejection = key trigger
- Clean shorts only if price stays below pivot
NASDAQ — Bullish continuation
- What I see
- Strong trend intact (higher highs)
- Holding above pivot comfortably
- Pullbacks shallow = strength
- Bias: Buy dips
- Best long candidate today
- Continuation toward R1 / R2
S&P 500 — Bullish (but slower)
- What I see
- Strong reclaim and hold above pivot
- Trend intact but less aggressive than NASDAQ
- Bias: Buy dips
- More grind than breakout
GOLD — Neutral / range
- What I see
- Choppy structure
- Sitting around pivot
- No clear continuation after prior bounce
- Bias:
- Range trade
- Fade extremes
Big picture
Strong divergence now:
- US indices → Bullish trend intact
- Europe → Weak / corrective
- Gold → Indecision
Most likely scenario today
- Early push up
- US continues higher
- Europe fails to follow
- DAX/FTSE roll over later
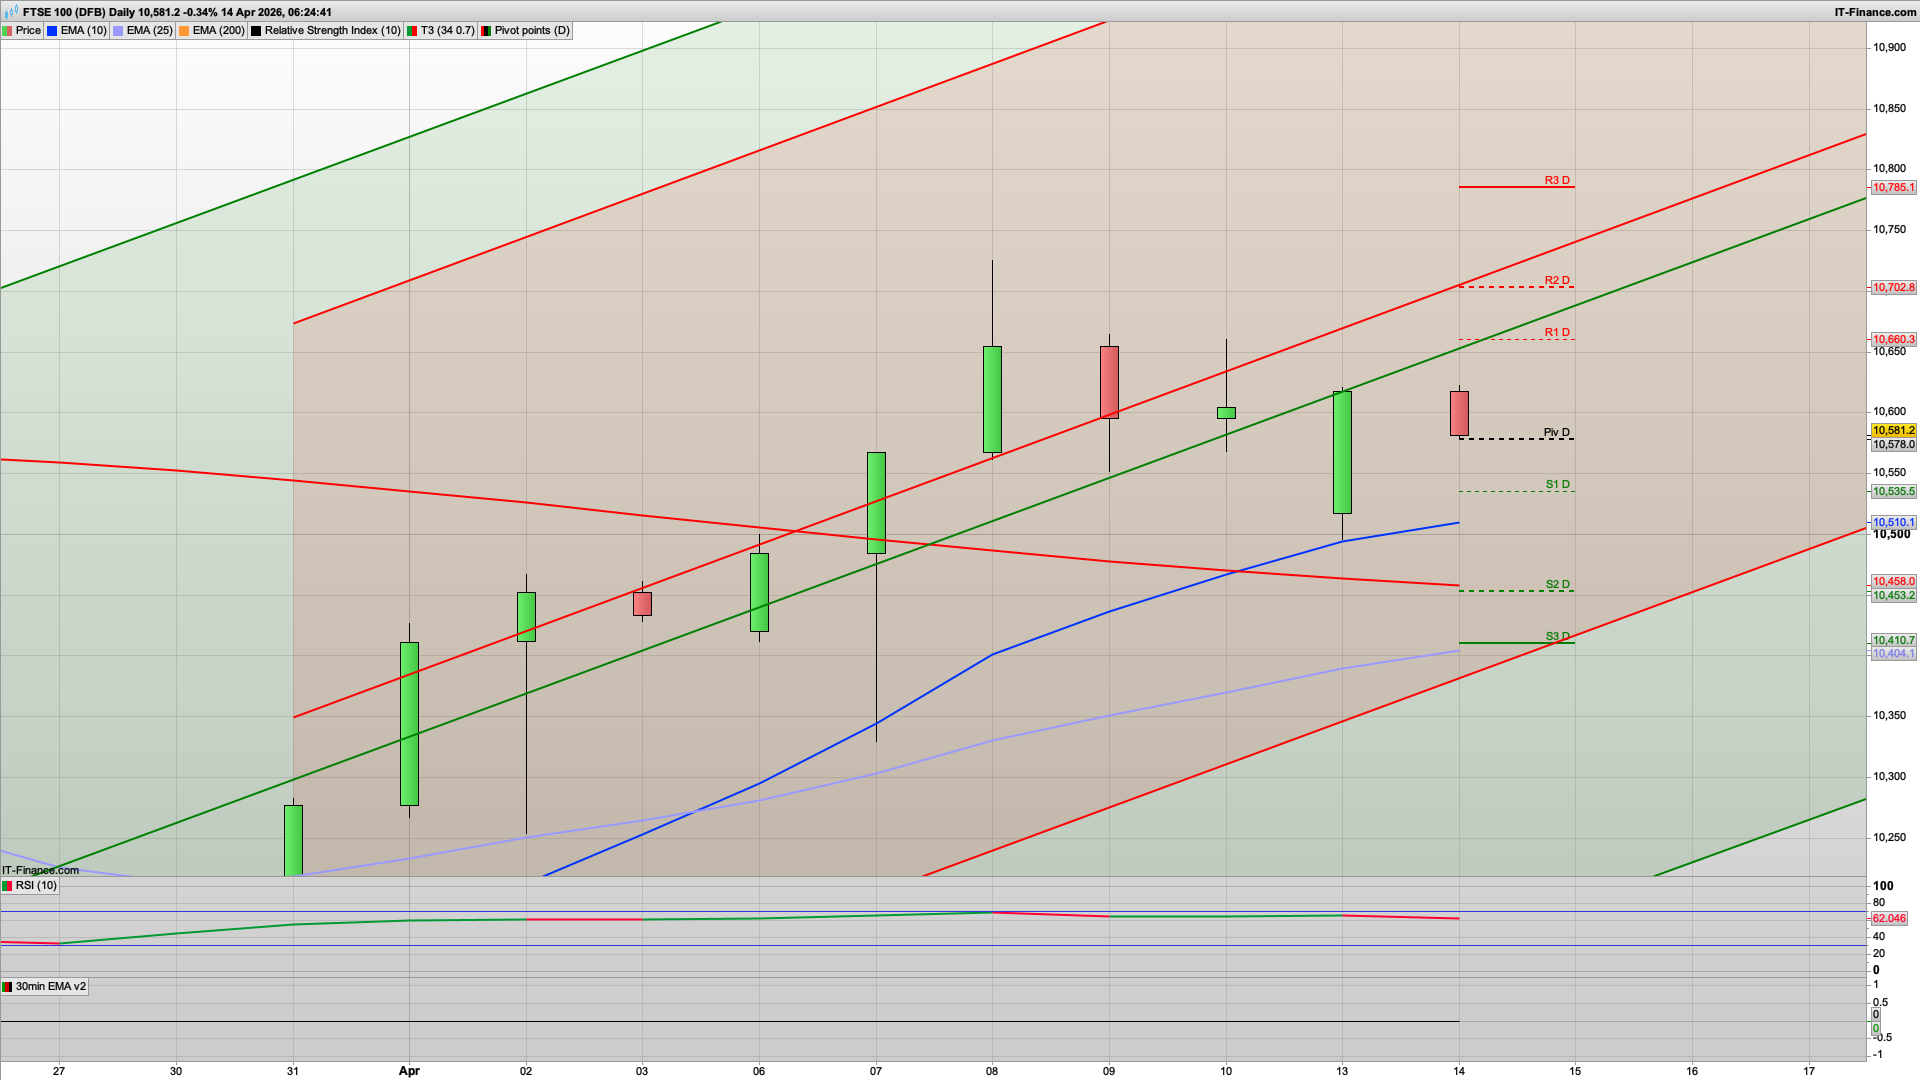
The 10615 resistance area held overnight and we have seen a small drop off from there. As such we may well see a rise and dip today as a bear Tuesday plays out. The bulls certainly fought back well yesterday for the bull Monday and the S&P500 closed the gap once again - the usual Monday pattern of gap down then climb during the session to close it. That has made the S&P500 charts pretty bullish going into today with the 2h chart showing 6884 as support, pretty much where we are as I write this.
That said, it may well drop a bit further to test the daily pivot around the 6850 level and then climb back towards the 6900 area or higher.
For the FTSE100 it is looking a bit weaker and as such shorting the rallies today looks to be the play with any potential rise towards the 10660 area looking like a good shorting spot. Initially we are on the daily pivot and the 30m 200ema support at 10580 so could see an initial climb from here to start with.
Below 10580 then S1 at 10535 is next up and the key fib at 10512. The daily chart remains bullish, with 25ema support at 10405 currently so any longer time frame drop down to that moving average may well see a bounce.
Prior to the 10660 area we do have the 2h chart resistance levels at 10630 with both the Hull MA at 10629 and the red coral at 10635. Keep an eye on this area in case any rise falters here and if it does then it is worth shorting this area.
Above 10660 then 1688 is daily resistance, with 10783 higher still - unless news driven I don't think we will see these today.
Talking of news, at 1330 there is the USA March PPI figure with a forecasted rise to 1.2% - a kick up win that may well see the bears appear on the S&P500.
Good luck today.
Interested in how to start trading the FTSE 100? Frequently Asked Questions on Spread betting
Recommended Broker for trading - MT4/5, web and mobile

IC Markets - offers market leading pricing and trading conditions by providing clients with True ECN Connectivity; this allows you to trade on institutional grade liquidity from the world’s leading investment banks, hedge funds and dark pool liquidity execution venues. Highly recommended!
Join my Membership for Trading Tips, Support and Resistance Levels with Live Trading
If you would like more detailed analysis for FTSE 100, DAX40, Gold and the S&P500, including the trades that I am looking to take myself, then please join my active members community.
Keep up to date with new website posts, free sign up below
