
Technical analysis for 15th April 2026
FTSE100
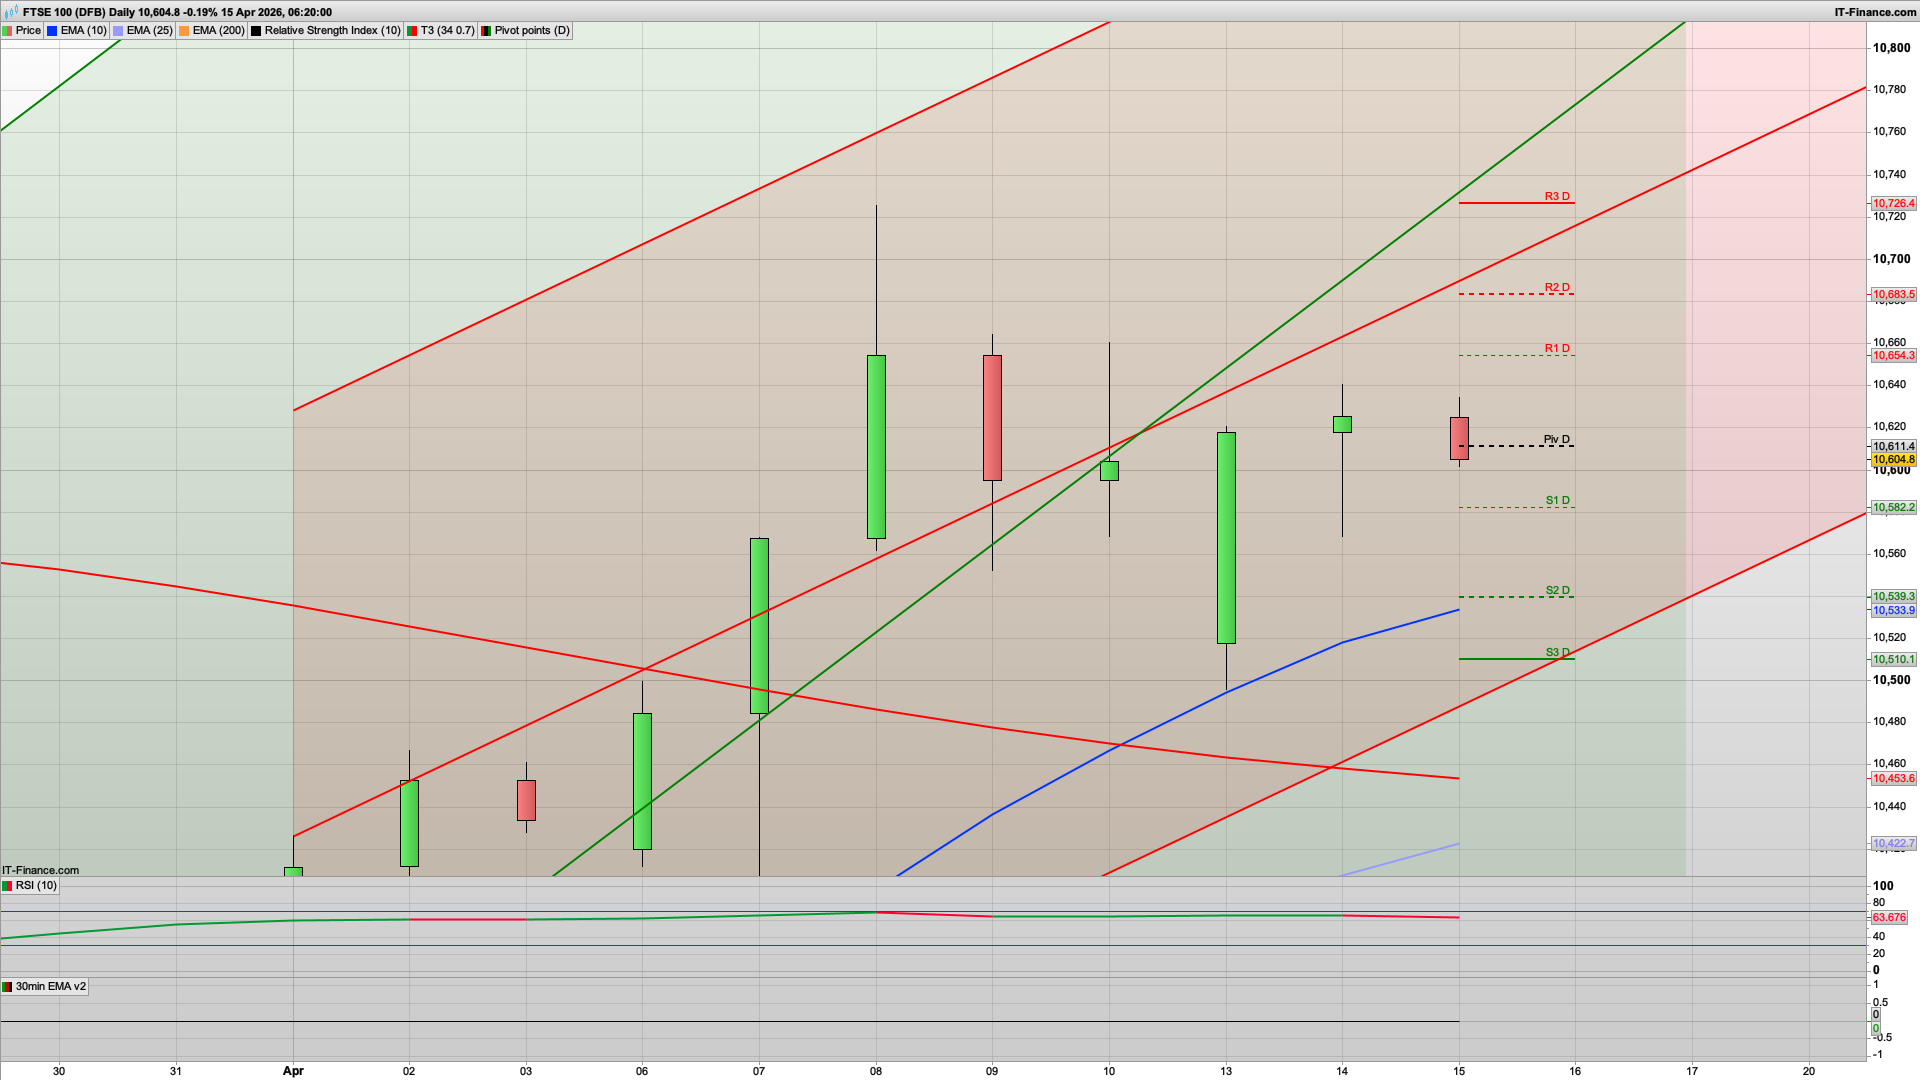
- Bias: Neutral → Slight Bearish
- Rejection candle at resistance again
- Weak follow-through after prior rally
- Sitting right on pivot = indecision
- Plan
- Sell below 10,580
- Only long above 10,688 with strength
- Expect range / slight downside bias
DAX40
- Bias: Bearish (weak structure)
- Clear rejection candle at upper channel / resistance
- Price sitting just under pivot
- Momentum fading after recent push up
- Lower high forming vs prior candle
- Plan
- Sell below 24,050–24,100
- Targets: S1 → 23,900 → deeper into channel
- Only flip if strong reclaim above R1
- Expect pullback day
NASDAQ (US Tech 100)
- Bias: Bullish (trend intact)
- Strong trend still: higher highs + higher lows
- Small indecision candle = pause, not reversal
- Holding well inside rising channel
- Plan
- Buy pullbacks into:
- Pivot / EMA zone (~25,700–25,800)
- Targets: R1 → R2 continuation
- Expect continuation after dip / consolidation
S&P 500 (US 500)
- Bias: Bullish (clean continuation)
- Strong bullish candle prior → now small pause
- Holding above rising structure + EMAs
- No breakdown signs
- Plan
- Buy dips toward:
- Pivot (~6,940 area)
- Upside: 7,000 → R1
- Expect grind higher
GOLD (XAUUSD)
- Bias: Neutral (range / distribution)
- Losing momentum after recent highs
- Mixed candles + flattening structure
- Holding pivot but not trending cleanly
- Plan
- Sell failed pushes into R1
- Buy deeper support (S1/S2)
- Avoid chasing middle
- Expect choppy / two-way trading
Well it's starting to look a bit more positive and we may well be on track for a test of the 10688 resistance level before too long. Above that then we still have the 10783 as a potential level to look for.
Initially today we may well see the bulls try and defend any dip below 10600 and a small flush down to the 10580 S1 and 30m 200ema level would fit the chart well. I would like to see this hold for a push up towards the 10640 recent high again, and ideally 10688. If we get some USA strength then it should help the FTSE100, despite the IMF warning! The S&P500 will need to defend the pivot support at 6943, and if it does then the bulls will be looking to break the 7000 area.
If the FTSE100 bears were to break 10580 then look for a slide down to the 10545 key fib and S2 level at 10539, and once again a level that I would like to see defended if it gets tested. Lower down than the 25ema is now at 10425 on the daily chart though not expecting that today!
On the upside, I am thinking that the 10688 level will more than likely hold as resistance today as the US/Iran situation continues to play out.
No major UK centric news out today so the bulls will certainly be keen to defend the 10600 area in the short term.
Good luck today.
Interested in how to start trading the FTSE 100? Frequently Asked Questions on Spread betting
Recommended Broker for trading - MT4/5, web and mobile

IC Markets - offers market leading pricing and trading conditions by providing clients with True ECN Connectivity; this allows you to trade on institutional grade liquidity from the world’s leading investment banks, hedge funds and dark pool liquidity execution venues. Highly recommended!
Join my Membership for Trading Tips, Support and Resistance Levels with Live Trading
If you would like more detailed analysis for FTSE 100, DAX40, Gold and the S&P500, including the trades that I am looking to take myself, then please join my active members community.
Keep up to date with new website posts, free sign up below
