
Technical analysis for 16th April 2026
FTSE 100
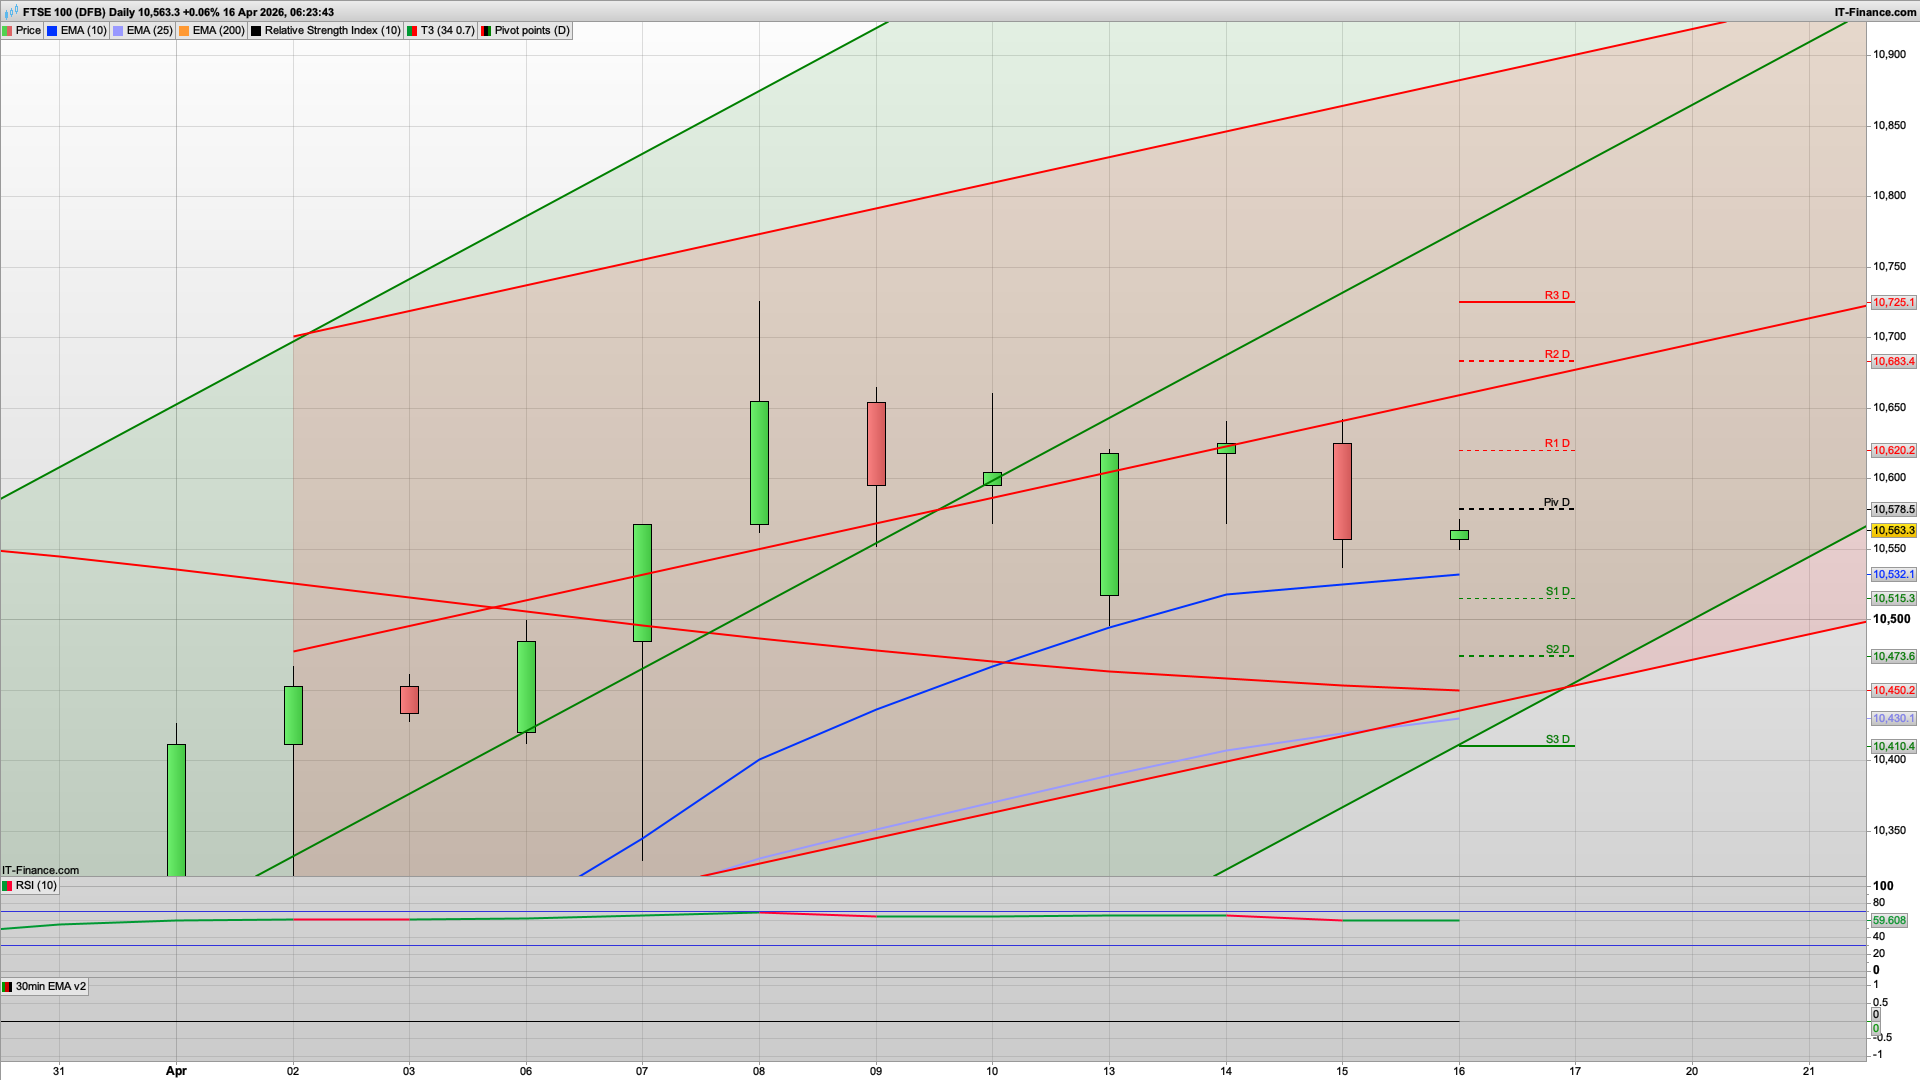
- Bias: Neutral → Slight Bearish
- Clear rejection candle previous session
- Now weak bounce / indecision
- Sitting around pivot, below momentum
- Plan
- Sell below 10,580–10,600
- Only long if reclaim + strength above 10,650
- Expect range with downside risk
DAX40
- Bias: Bullish (but near resistance)
- Clean sequence of higher closes
- Holding above pivot + trendline support
- Now pushing into R1 / upper channel
- BUT:
- Approaching resistance cluster (R1–R2 + channel top)
- Plan
- Buy dips toward pivot (~24,050 area)
- Sell only if clear rejection at 24,200–24,300
- Expect early push → possible stall at highs
NASDAQ
- Bias: Strong Bullish
- Trend accelerating: strong bullish candles
- Price riding upper channel
- EMAs fully aligned upward
- No weakness here.
- Plan
- Buy pullbacks only (ideal: pivot / channel mid)
- Avoid chasing highs unless breakout confirms
- Expect trend continuation / momentum day
S&P 500
- Bias: Bullish continuation
- Strong structure: higher highs/lows intact
- Holding above pivot and trendline
- No rejection signs yet
- Plan
- Buy dips toward 7,000 pivot zone
- Upside into R1/R2
- Expect steady grind higher
GOLD
- Bias: Bullish (recovering momentum)
- Strong bounce from lower channel
- Holding above pivot again
- Structure = higher low forming
- Plan
- Buy dips into 4,800–4,820 zone
- Target R1 → continuation higher
- Expect upside attempt / trend resumption
Key Theme Today
- US markets = strong trend continuation
- DAX catching up (late-cycle push)
- FTSE lagging again
- Gold regaining strength
Best setups:
- Buy NASDAQ / S&P dips (priority trades)
- Buy DAX dips but take profits quicker
- Sell FTSE rallies
- Buy Gold pullbacks
The S&P500 has broken above the 7000 level and whilst the FTSE100 is the weaker market currently it is helping it hold it around the 10600 area. The bulls will need to regain their strength though if we are to see a test of the 10688 level today. Initially we are in a bearish mode with a sell the rallies play still working out, and the 2h chart is also bearish with Hull MA resistance at 10590.
With the daily pivot at 10578 as well, any early rally into this zone looks like it will then see a drop down to the 10515 level to test S1, and possibly the 10502 key fib. That said, 10540 held well yesterday so also keep an eye on this level and if it starts to climb from here then it will be worth a long.
The daily chart remain bullish with 25ema support at 10430 so we are currently experiencing a pull back in the overall bullish trend still - and a test of this moving average will likely see a bounce, especially as the US is powering on up still. The US markets are now the strongest.
A nice little kick up in GDP at 0.5% for Feb and also the 3 months to Feb also at 0.5% will help some confidence to creep in as well.
If the bulls break above the 10600 level today then look for a test of 10644 key fib to start with and then the daily resistance at 10688 above that as well. If the S&P500 can continue to pull away from the 7000 level and gets a possible rise to 7063 today then it may well help the FTSE100 recover from any dip this morning.
The DAX40 is also likely to get a rise towards the key fib and R2 level at the 24245 area so look out for this as well.
Good luck today.
Interested in how to start trading the FTSE 100? Frequently Asked Questions on Spread betting
Recommended Broker for trading - MT4/5, web and mobile

IC Markets - offers market leading pricing and trading conditions by providing clients with True ECN Connectivity; this allows you to trade on institutional grade liquidity from the world’s leading investment banks, hedge funds and dark pool liquidity execution venues. Highly recommended!
Join my Membership for Trading Tips, Support and Resistance Levels with Live Trading
If you would like more detailed analysis for FTSE 100, DAX40, Gold and the S&P500, including the trades that I am looking to take myself, then please join my active members community.
Keep up to date with new website posts, free sign up below
