
Technical analysis for 26th March 2026
FTSE 100 — Bearish (weak recovery failing)
- Structure
- Small bounce → immediate stall
- Still below EMA resistance
- Lower highs remain intact
- Trend channel respected
- FTSE remains structurally weak.
- Bias: Sell rallies
DAX — Bearish (rejection confirmed)
- Structure
- Weak upside attempt → bearish rejection candle
- Price still below pivot + EMA resistance
- Lower-high structure holding
- Channel still cleanly downward
- Bias: Sell rallies
NASDAQ — Bearish continuation
- Structure
- Rejection at pivot / EMA zone
- Follow-through weakness
- Lower highs intact
- No break in trend structure
- Bounce has clearly failed.
- Bias: Sell rallies
S&P 500 — Bearish (bounce fading again)
- Structure
- Lower high printed after bounce
- Price rolling over near pivot
- EMAs still downward
- Channel respected
- Momentum turning back down.
- Bias: Sell rallies
GOLD — Bearish (continuation pressure)
- Structure
- Small bounce → bearish follow-through
- Price still below pivot + EMA cluster
- Strong descending channel
- Lower highs intact
- Trend remains dominant.
- Bias: Sell rallies
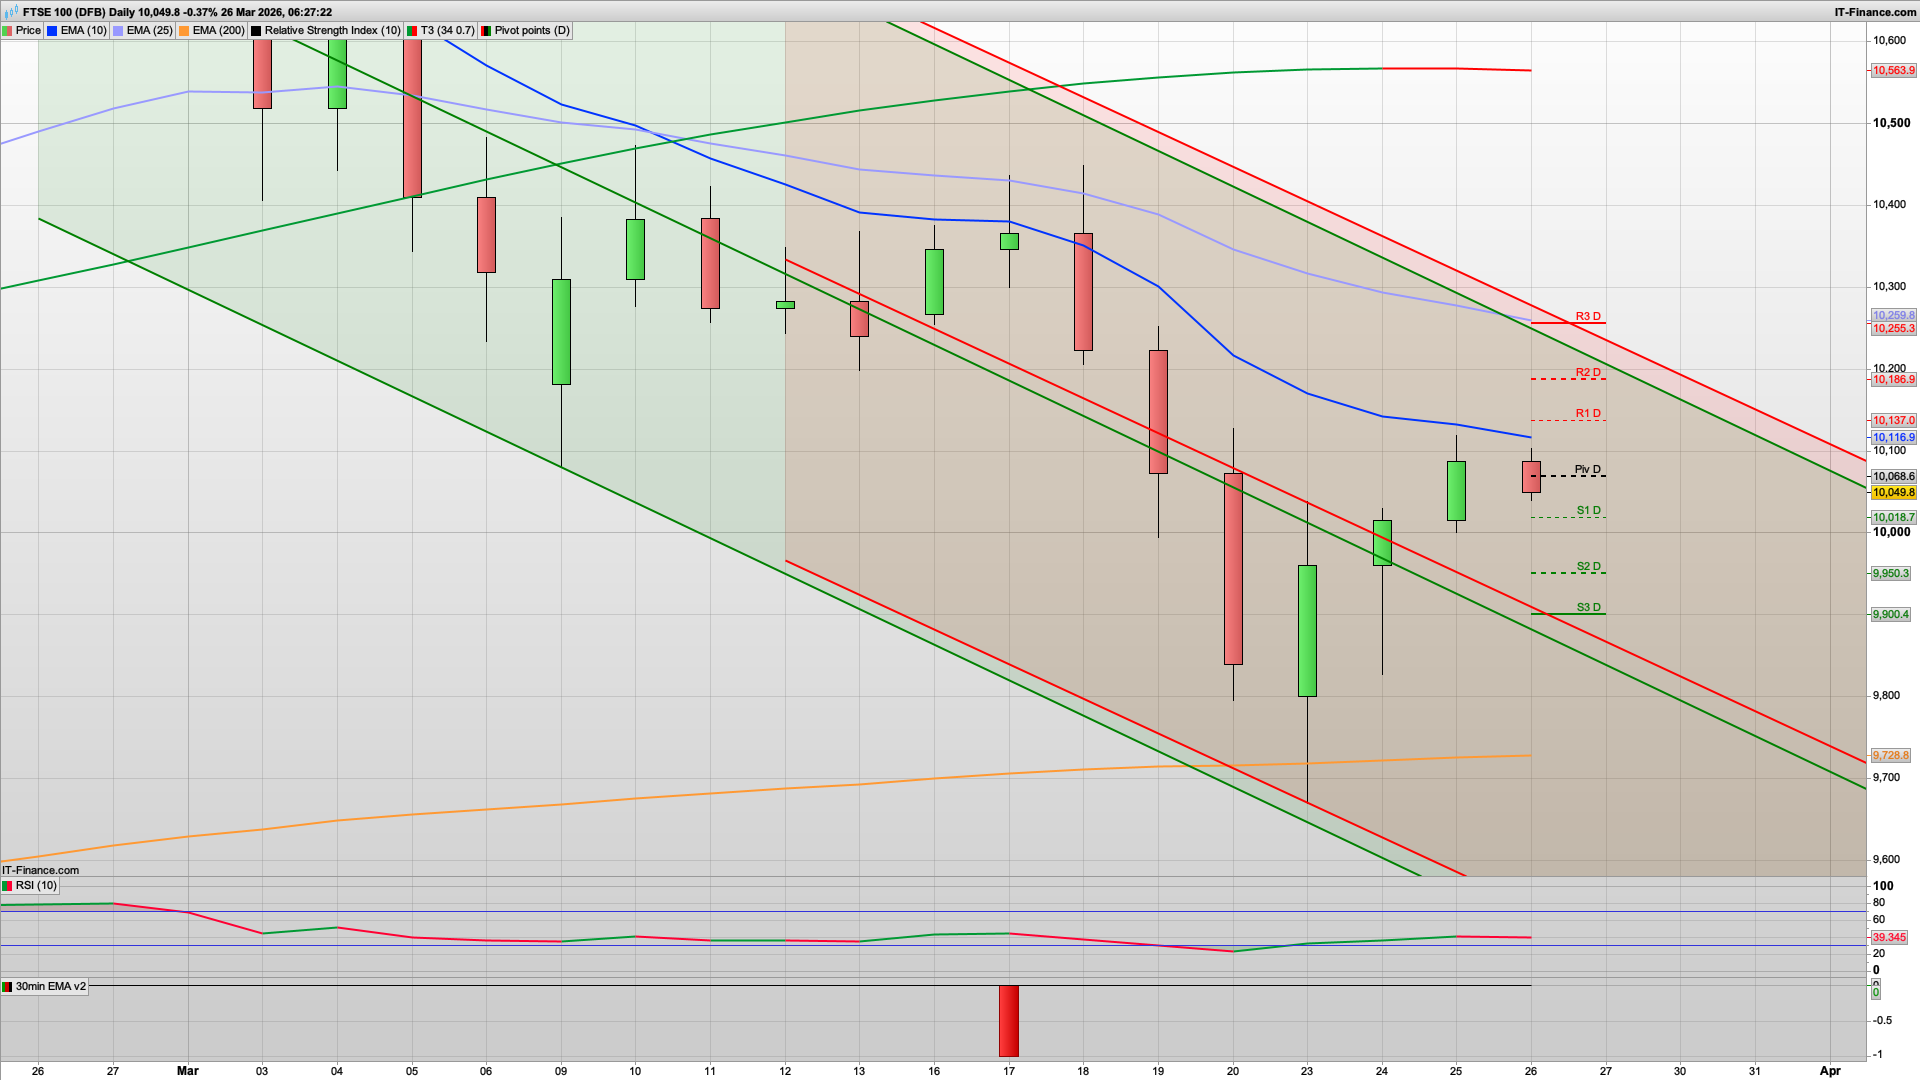
The bulls managed to hold the price above the 10000 level yesterday so will be looking to keep that momentum going, but we may well see a rise and dip today with the 10120-10140 area still remaining as strong resistance. As such should we rally to this area then it looks to be a decent shorting area for a run down to the 10018 S1 level.
If the 10000 were to break then the 2h supports come into play, namely the 9950 Hull MA and then the 9900 coral line (green). This latter level should provide decent support as it is also S3 for today, though I am not expecting it to get that low - but given the volatility it's not totally out of the question.
The trend remains down still so shorting the rallies is the preferred play. The 30m coral is now red and has 10105 resistance. The bulls have still failed to test the 10138 resistance level stalling just above the 10115 level again yesterday so that zone still looks like capping any rallies for the moment - some random Trump social media post notwithstanding.
If the bulls were to break above the 10138 level then it could manage another test of the 25ema on the daily at 10255, and we also have R3 here so a pretty key level, but I don't think it will get that high today.
Key Tip Today
- This is a classic “failed bounce → continuation” setup
- So:
- Don’t chase longs
- Look to sell strength
- Let price come into resistance
It's a similar picture for the S&P500 and DAX40 today with a potential rise and dip with the daily pivots at 6595 and 22920 respectively looking like decent resistance and entry levels.
Good luck today.
Interested in how to start trading the FTSE 100? Frequently Asked Questions on Spread betting
Recommended Broker for trading - MT4/5, web and mobile

IC Markets - offers market leading pricing and trading conditions by providing clients with True ECN Connectivity; this allows you to trade on institutional grade liquidity from the world’s leading investment banks, hedge funds and dark pool liquidity execution venues. Highly recommended!
Join my Membership for Trading Tips, Support and Resistance Levels with Live Trading
If you would like more detailed analysis for FTSE 100, DAX40, Gold and the S&P500, including the trades that I am looking to take myself, then please join my active members community.
Keep up to date with new website posts, free sign up below
