
Technical analysis for 27th March 2026
FTSE 100 — Bearish (slight strength but still corrective)
- Structure
- Slightly stronger bounce vs others
- But still under EMA resistance
- Channel still down
- No trend break
- FTSE is holding better, but still not bullish.
- Bias: Sell rallies (until breakout)
DAX — Bearish (weak bounce only)
- Structure
- Small green candle = minor relief bounce
- Still below pivot + EMA cluster
- Clear lower high remains
- Channel intact
- No structural change — just a pause.
- Bias: Sell rallies
NASDAQ — Bearish (bounce into resistance)
- Structure
- Small bounce after strong selloff
- Still below pivot + EMA resistance
- Trend channel holding
- No break of lower highs
- This is a classic pullback setup.
- Bias: Sell rallies
S&P 500 — Bearish continuation
- Structure
- Weak price action around pivot
- Lower highs + lower lows intact
- EMAs trending down
- No strong bullish follow-through
- Market still heavy
- Bias: Sell rallies
GOLD — Neutral → Slight bullish pullback
- Structure
- First meaningful green bounce
- Holding around pivot
- Momentum slowing on downside
- Still within broader down channel
- Gold is the only market showing early recovery signs.
- Bias: Neutral / slight buy dips (short-term)
- (But not a confirmed trend reversal yet)
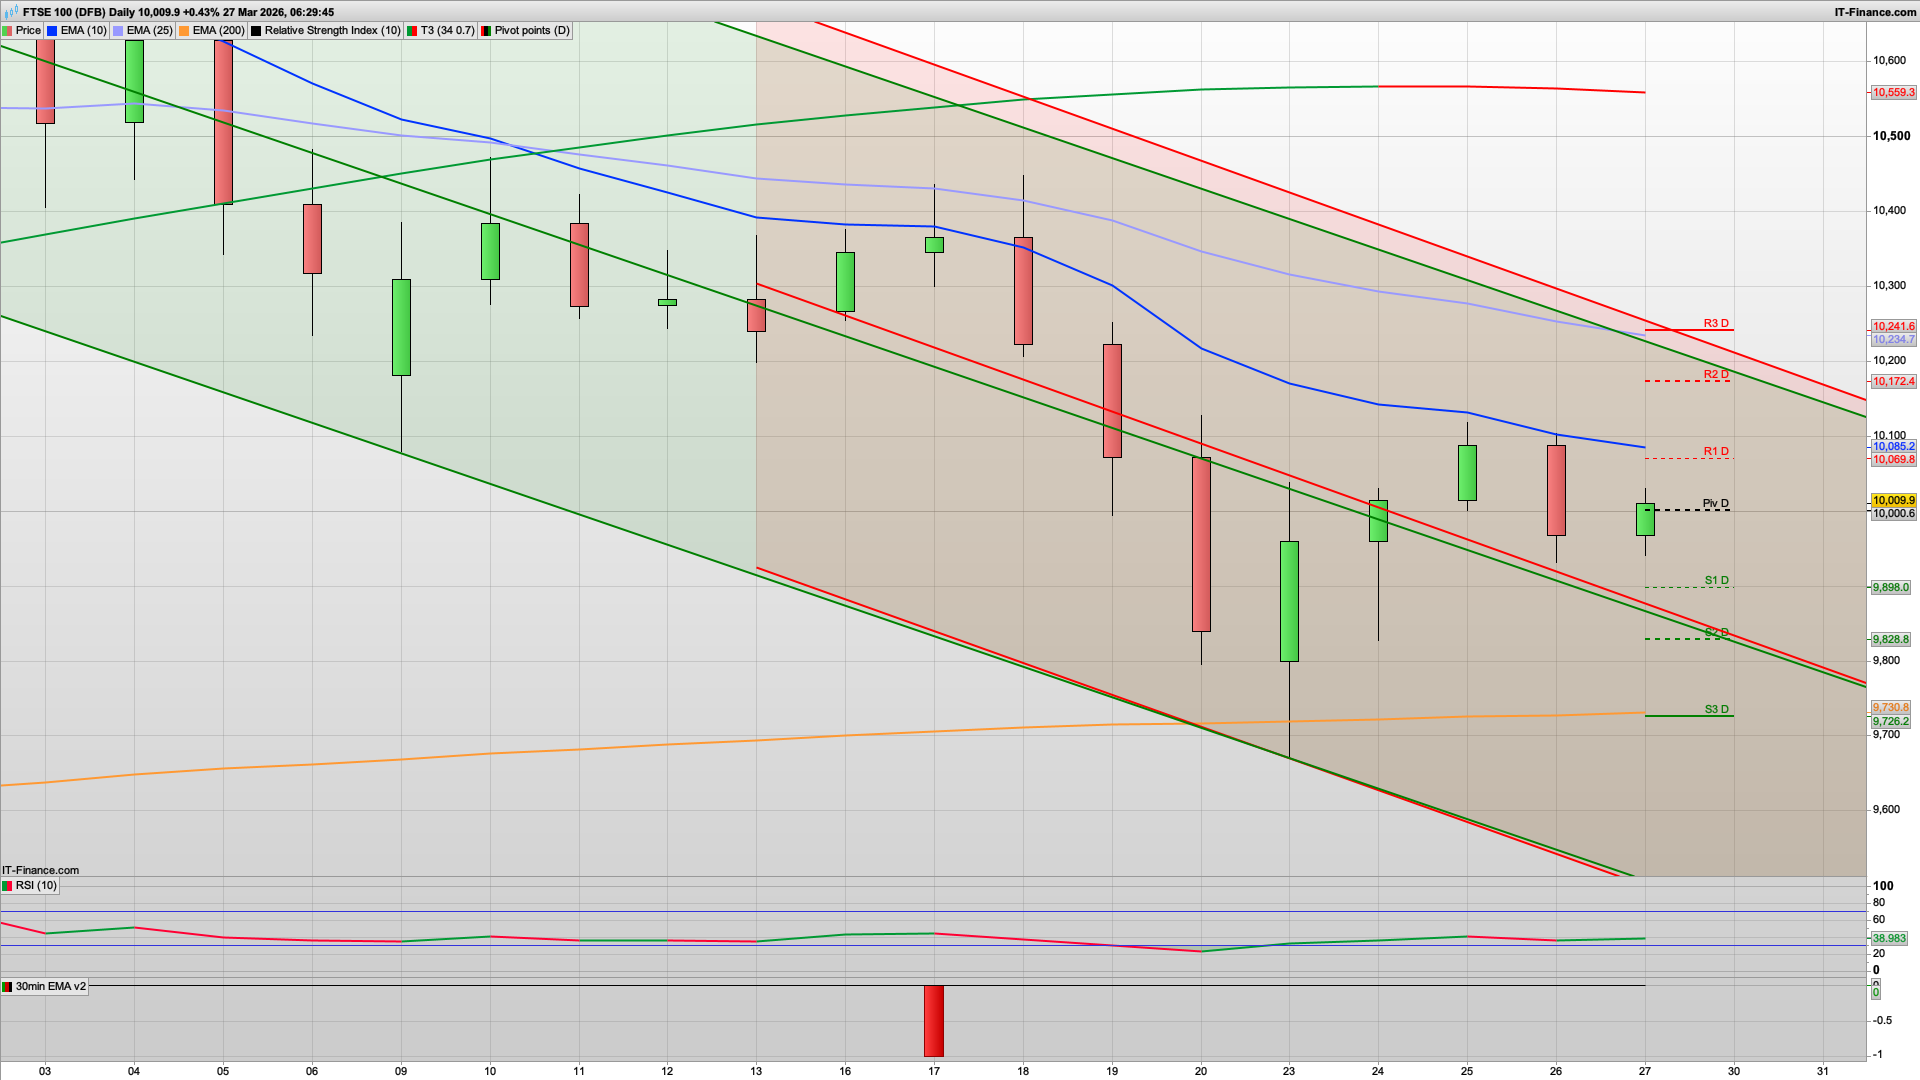
As we start the last session of the week, the bulls are desperately trying to hold the price above the 10000 level and if they manage to do so this morning then we should see rise towards the 10069 R1 level. We also have the key fib with initial resistance at the 10062 level so any rise may well falter here and a drop back down to the round number 10000 and daily pivot here.
Initially we will need to hold the 9970 area as we have the 30m coral here and also the Hull MA on the 2h chart - though this latter timeframe isn't locked in as bullish, its a good sign for the bulls that the price is above that line.
Ultimately today we may well see a rise towards the 10120 daily resistance level and the line that has held as resistance all week. If we see this towards the end of the day then we may well see some shorting and profit taking on longs here. Above this level then 10172 is R2, and 10191 for the next daily level of note - once again it might well take a Trump tweet to drive through the key resistance levels and target the next one.
Support wise, then below the 9975 area 9921 is the key fib and the next level to look out for with S1 9898 below that. If the FTSE100 does get bearish again then ultimately, we may well see a slide down to the 9670 level that held so well the other day, with the possibility of further downside towards the 9525 area, and possibly 9400 - the longer the war(s!) drag on then the more pessimistic things will likely become..... Inflation will remain elevated, which feeds into rate rises, which feeds into economies slowing down etc etc etc
Anyway, to end on a more positive note, let's see if the bulls can drive the price up from the 10000 area today.
Good luck and enjoy the weekend.
Interested in how to start trading the FTSE 100? Frequently Asked Questions on Spread betting
Recommended Broker for trading - MT4/5, web and mobile

IC Markets - offers market leading pricing and trading conditions by providing clients with True ECN Connectivity; this allows you to trade on institutional grade liquidity from the world’s leading investment banks, hedge funds and dark pool liquidity execution venues. Highly recommended!
Join my Membership for Trading Tips, Support and Resistance Levels with Live Trading
If you would like more detailed analysis for FTSE 100, DAX40, Gold and the S&P500, including the trades that I am looking to take myself, then please join my active members community.
Keep up to date with new website posts, free sign up below
