
Technical analysis for 25th March 2026
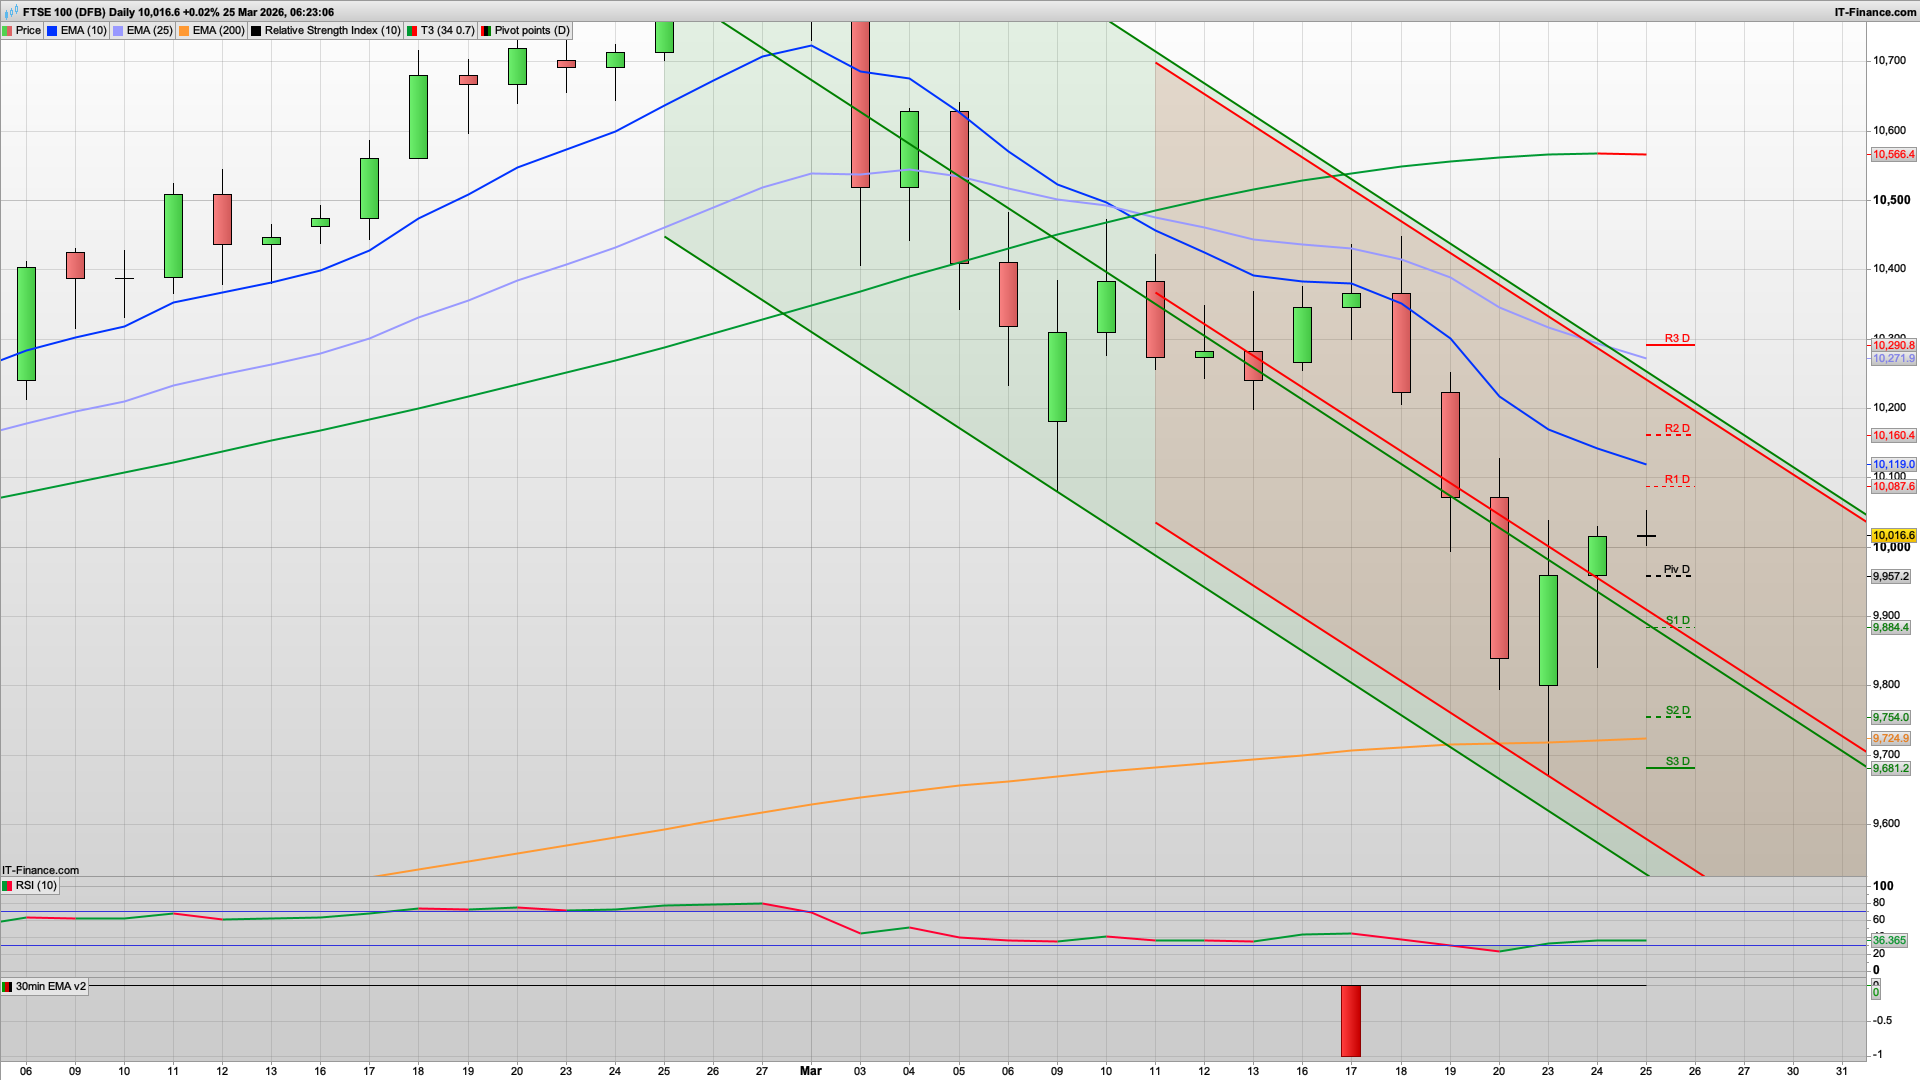
FTSE 100 — Bearish (corrective bounce only)
- Structure
- Bounce from lows, but still below key EMAs
- Price sitting near pivot
- Downtrend channel intact
- Lower high still controlling
- FTSE remains weak overall.
- Bias: Sell rallies
DAX — Bearish (stall after bounce)
- Structure
- Strong bounce from lows, but now stalling at pivot
- Still below EMA cluster + channel resistance
- No higher high → trend still intact
- Lower-high structure remains
- Bias: Sell rallies
NASDAQ — Bearish (bounce fading)
- Structure
- Bounce into pivot / EMA resistance
- Small indecision candle forming
- Still inside descending channel
- No break of structure
- Momentum is fading after the bounce.
- Bias: Sell strength
S&P 500 — Bearish continuation
- Structure
- Weak bounce into pivot
- EMAs clearly downward
- Lower highs + lower lows intact
- Channel structure clean
- No sign of reversal.
- Bias: Sell rallies
GOLD — Bearish (bounce into resistance)
- Structure
- Small bullish reaction after selloff
- Price pushing into pivot / EMA zone
- Still in strong descending channel
- Lower highs intact
- This is a textbook retracement move.
- Bias: Sell rallies
The markets are looking a bit more positive this morning with the FTSE100 back above 10000 (just!) and the DAX40 and S&P500 also looking tentatively bullish. Gold has also seen a large rise overnight from the 4350 support level tested yesterday. As such, for the FTSE100 I am thinking that we may well see a small dip to start with and a test of the daily pivot level at 9958. If this holds then we may well see a bounce towards the daily resistance level at 10138.
On route to that though we have the 10095 in play still (and also R1 at 10087), and a possible stall at Friday's high level at 10128. If the bulls were to break higher then look for a test of the R2 level at 10160 - though unless its news driven I can't see that today (though its never a never!)
Support wise, below the daily pivot then 9820 is the 2h Hull MA, but prior to this I am liking the key fib and S1 area at 9900 as decent support should it get tested.
- UK inflation figures have also just come out, After last month's slowdown,
annual inflation was unchanged. The largest upwards driver was the price of clothing, which rose this
month but fell a year ago. This was offset by falls in petrol costs, with prices collected before the start of the conflict in the Middle East and
subsequent rise in crude oil prices.
Key read today
- All markets are showing bounce → stall behaviour
- This is typical continuation setup inside a downtrend
- Best approach:
- Let price push into resistance (pivot / EMAs)
- Look for rejection → continuation lower
Interested in how to start trading the FTSE 100? Frequently Asked Questions on Spread betting
Recommended Broker for trading - MT4/5, web and mobile

IC Markets - offers market leading pricing and trading conditions by providing clients with True ECN Connectivity; this allows you to trade on institutional grade liquidity from the world’s leading investment banks, hedge funds and dark pool liquidity execution venues. Highly recommended!
Join my Membership for Trading Tips, Support and Resistance Levels with Live Trading
If you would like more detailed analysis for FTSE 100, DAX40, Gold and the S&P500, including the trades that I am looking to take myself, then please join my active members community.
Keep up to date with new website posts, free sign up below
