
Technical analysis for 2nd July 2026
We head into Thursday’s session with markets looking a little more cautious after yesterday’s mixed price action. The DAX managed to hold up relatively well, the FTSE softened slightly, and the S&P 500 lost a little momentum as traders trimmed risk ahead of the next round of US data. Gold remains under pressure and still looks like the weakest market of the four from a trend perspective.
For me, the broader picture hasn’t changed too much. I still favour buying pullbacks in the major equity indices while the structure remains constructive, but I’m also mindful that after the recent run higher we could see more two-way price action rather than straight-line trend days. Gold continues to look vulnerable unless buyers can prove otherwise.
For today, I still think the best opportunities are likely to come from buying weakness in the equity indices rather than trying to pick tops. The DAX remains the cleanest bullish market of the three indices, the FTSE still looks constructive provided support holds, and the S&P 500 remains bullish overall even if it’s starting to trade with a little less momentum.
Gold remains the outlier. Until it starts showing genuine strength, I continue to see rallies as selling opportunities rather than signs of a bottom.
As always, the key is not just having a directional view, but waiting for price to confirm it. Let the market come into your areas, stay disciplined with risk, and don’t force trades if the session becomes messy.
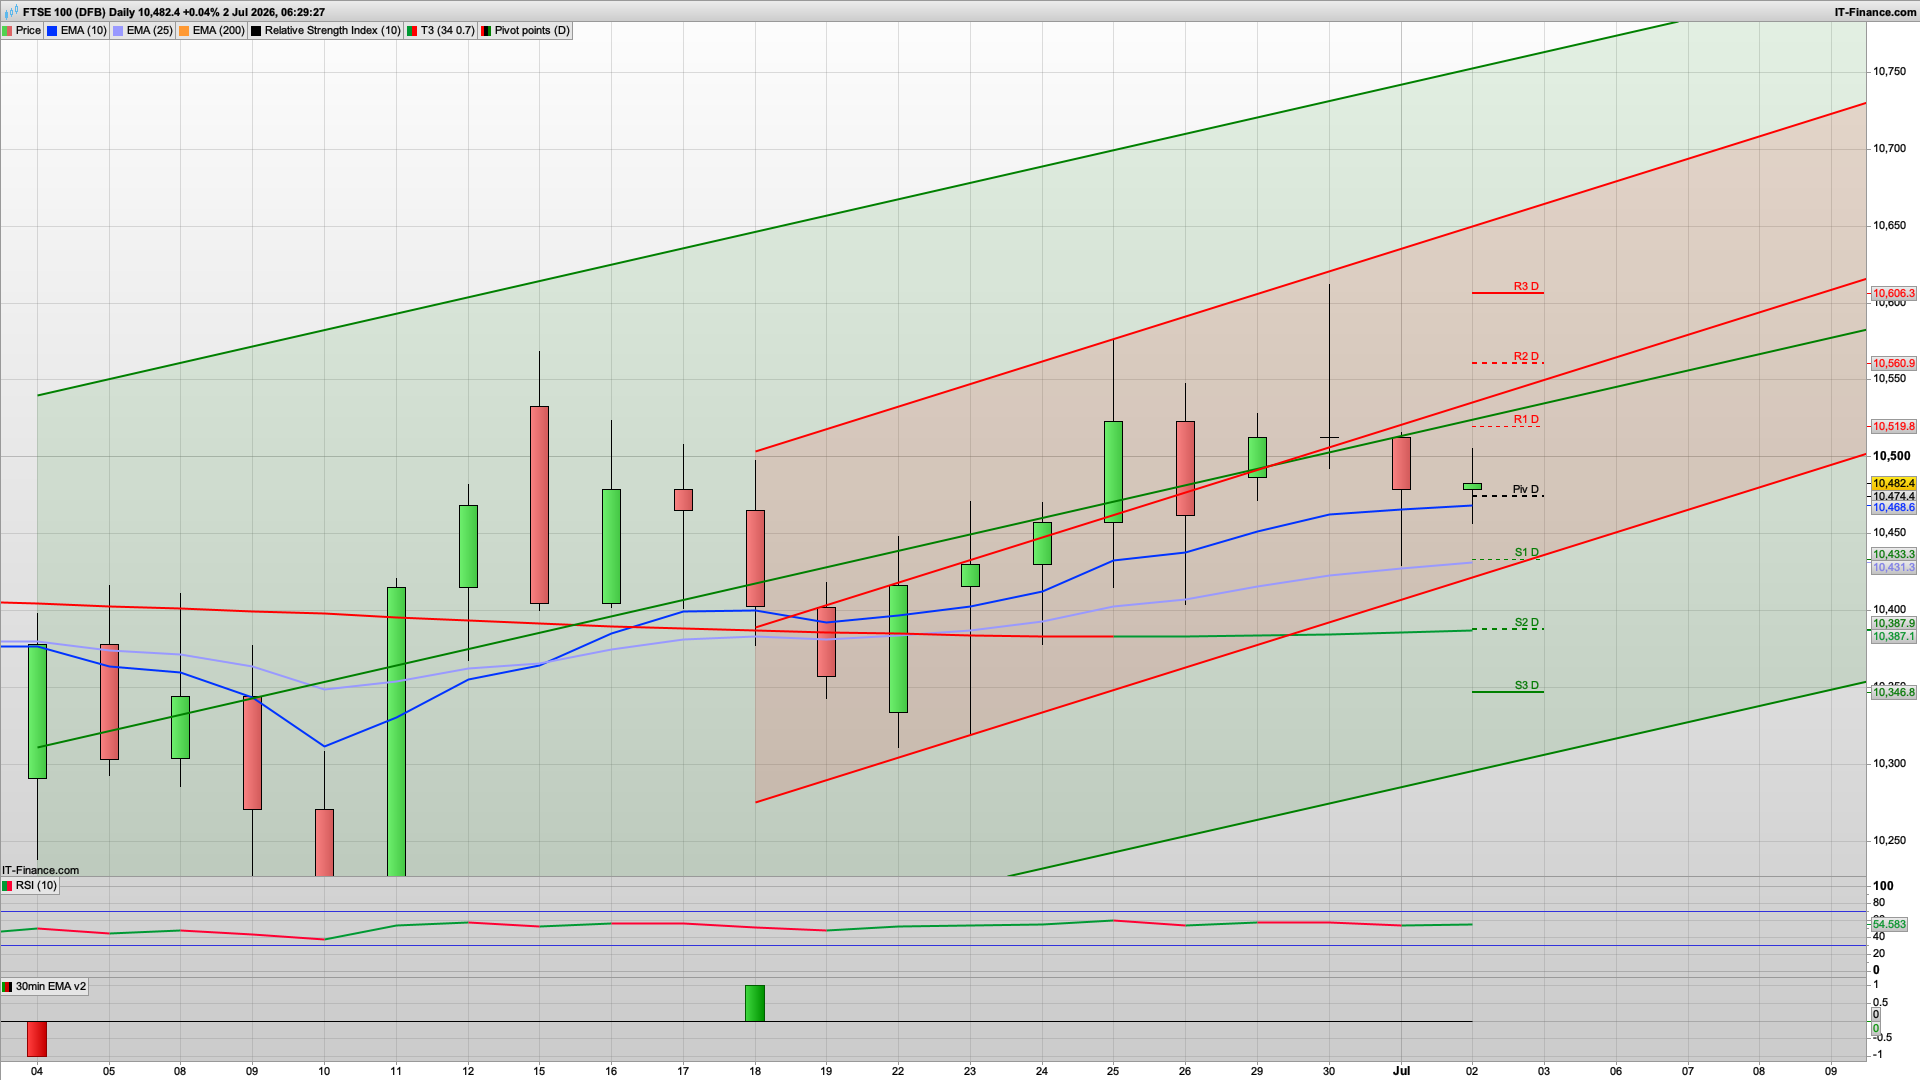
FTSE 100
- Bullish
- FTSE still looks one of the cleaner long setups.
- Why
- Trend remains up inside the rising channel.
- Price is above both EMAs and holding above the rising trendline.
- Yesterday’s small pause candle hasn’t damaged structure at all.
- RSI is still comfortably above 50, so momentum remains constructive.
- Levels
- Support: 10,474 pivot / EMA cluster, then 10,433, then 10,387
- Resistance: 10,520 (R1), 10,561 (R2), 10,606 (R3)
- Bias summary
- Bullish while above 10,470.
- Still looks like a buy-the-dip market rather than a short.
DAX40
- Bullish
- The DAX still looks constructive on the daily.
- Why
- Price is above the pivot and still holding the recent breakout structure.
- It remains above both the EMA25 and EMA200.
- The sequence from the 26 June low is still one of higher lows / higher highs.
- RSI is holding above 50, so momentum still favours buyers.
- Price is now pushing toward the upper channel resistance / R1 zone, so trend is bullish, but a little extended intraday.
- Levels
- Support: 25,012 pivot, then 24,928 / 24,919, then 24,814
- Resistance: 25,138 (R1), 25,222 (R2), 25,348 (R3)
- Bias summary
- Bullish while above 25,010 pivot.
- Ideal scenario is a pullback toward 25,010–24,930 and then continuation higher.
Nasdaq 100
- Neutral to slightly bullish
- This one is less clean than DAX/FTSE.
- Why
- It’s still trading above the EMA25 and EMA200, which is constructive.
- But price is sitting right on the pivot / near channel resistance, and yesterday’s candle showed rejection after the strong 30 June push.
- The market is still within the broader descending channel structure, so it hasn’t fully broken into open space yet.
- Momentum improved, but today’s candle suggests the market may need a pause before another leg up.
- Levels
- Support: 29,940 pivot, then 29,800 / 29,780, then 29,634
- Resistance: 30,033, then 30,184 (R1), 30,454 (R2)
- Bias summary
- I’d call this slightly bullish above 29,940, but not a clean momentum long right here.
- Best read is neutral-to-bullish consolidation unless it reclaims 30,030–30,180 decisively.
S&P 500
- Bullish
- Still a solid bullish daily structure.
- Why
- Strong recovery from the 26 June low remains intact.
- Price is above pivot, above EMA25, and still holding a sequence of higher lows.
- The green “safe zone” / momentum structure is still supportive.
- It’s pushing into resistance overhead, but there’s no real sign of a bearish reversal yet.
- Levels
- Support: 7,490 pivot, then 7,460 / 7,447, then 7,432
- Resistance: 7,517, 7,531 (R1), 7,563 (R2), 7,603 (R3)
- Bias summary
- Bullish while above 7,490 pivot.
- A dip into 7,490–7,460 still looks buyable unless that zone fails.
Gold
- Neutral to mildly bullish rebound
- This is the one that has shifted the most from the last couple of days.
- Why
- The broader trend is still down on the daily — price remains under the EMA25 and EMA200 and within the falling channel.
- But price has now reclaimed the pivot area / upper side of the recent short-term base, and today’s candle is green again.
- That suggests a countertrend rebound is trying to develop.
- So I would not call gold outright bullish trend-wise, but the immediate daily bias is no longer clearly bearish.
- Levels
- Support: 4,040 pivot area, then 3,965 (S1)
- Resistance: 4,084 / 4,120 (R1), then 4,196 (R2)
- Bias summary
- I’d mark gold as neutral to mildly bullish for a rebound, but still countertrend unless it can get above 4,120–4,200.
- So for me it’s not a strong trend long, just a rebound bias rather than a clean short.
Other trading ideas
- Best long: FTSE 100
- Buy dips toward 10,475 / 10,430
- Upside targets: 10,520 → 10,560 → 10,605
- Second best long: DAX
- Buy pullbacks into 25,010–24,930
- Targets: 25,138 → 25,222 → 25,348
- Third long: S&P 500
- Buy dips while above 7,490
- Targets: 7,517 → 7,531 → 7,563
- Most cautious / least clean:
- Nasdaq = still constructive, but needs a cleaner break above resistance.
- Gold = rebound bias only, not yet a proper trend reversal.
Interested in how to start trading the FTSE 100? Frequently Asked Questions on Spread betting
Recommended Broker for trading - MT4/5, web and mobile

IC Markets - offers market leading pricing and trading conditions by providing clients with True ECN Connectivity; this allows you to trade on institutional grade liquidity from the world’s leading investment banks, hedge funds and dark pool liquidity execution venues. Highly recommended!
Join my Membership for Trading Tips, Support and Resistance Levels with Live Trading
If you would like more detailed analysis for FTSE 100, DAX40, Gold and the S&P500, including the trades that I am looking to take myself, then please join my active members community.
Keep up to date with new website posts, free sign up below
