
Technical analysis for 3rd July 2026
We head into Friday’s session with the tone across the equity indices still broadly constructive, but there are a couple of important shifts worth noting. The FTSE finished strongly yesterday and has pushed up to a fresh two-month high, helped by softer US labour data which eased rate-hike concerns and supported risk sentiment. The S&P 500 remains in an overall uptrend as well, although the move is starting to look a little more selective after the recent run higher, while the DAX continues to hold up well on pullbacks. Gold, meanwhile, has bounced with the weaker dollar, but for now I still see it as the more difficult market of the four to trust on the long side unless buyers can build on that recovery.
For me, today is less about chasing extended moves and more about seeing whether buyers can continue defending weakness into support. With US markets closed later for Independence Day, I’d also be prepared for thinner liquidity and the potential for more erratic price action into the afternoon. That means patience matters even more than usual, plus it's a Friday!
For today, I still think the indices are the better-looking markets, particularly the FTSE100 and DAX40. The FTSE100 has the clearest momentum after yesterday’s breakout, the DAX40 still looks technically constructive, and the S&P 500 remains bullish overall even if I’d be a little more cautious given the holiday-thinned conditions.
Gold is the more interesting one because the weaker dollar has given it a lift, but I’m not yet convinced that this is the start of a clean bullish trend rather than just a bounce within a broader messy structure. For now, I still think it needs to prove more before it becomes a high-conviction long market.
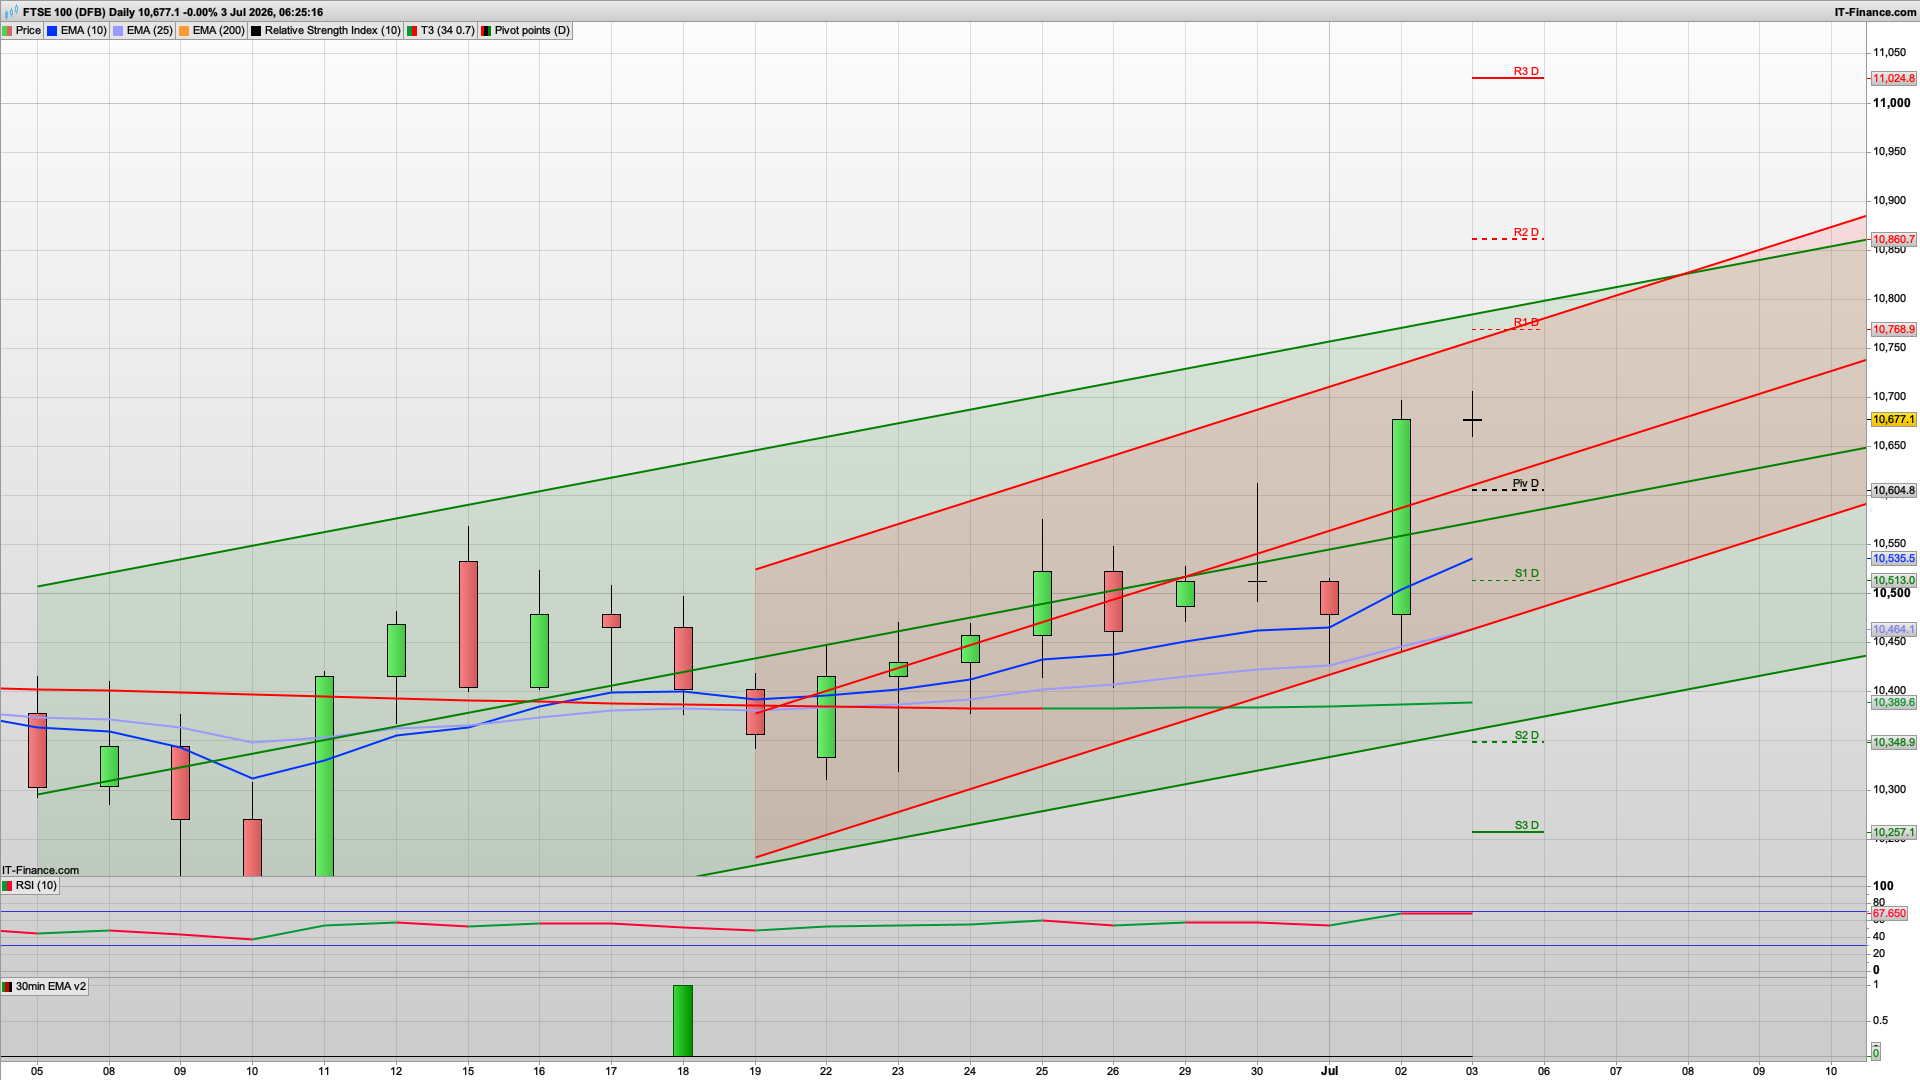
FTSE 100
- Bias: bullish continuation
- FTSE remains one of the cleanest charts.
- Strong rising channel remains intact.
- Price is above both key moving averages and above the rising trendline support.
- Yesterday’s candle was a big continuation candle, and today is holding those gains rather than giving them back.
- RSI is up near 68, so momentum is strong.
- Bullish while above 10,605.
- FTSE still looks like a buy-the-dip market on the daily.
DAX
- Bias: buy dips / bullish continuation
- The DAX still looks very constructive on the daily.
- Price is holding above the EMA25 and EMA200.
- It’s riding the upper half of the rising channel after a strong push from 30 June / 2 July.
- Today’s candle is small so far, but it’s holding the breakout gains rather than reversing them.
- RSI is up near 69, so momentum is strong, although a little stretched.
- As long as it holds above the 25,425 pivot, I’d keep a bullish daily bias.
- Best setup is a pullback buy rather than chasing right into resistance.
Nasdaq 100
- Bias: mixed / weakest of the indices
- This is the least convincing equity chart today.
- Price is sitting right on the pivot area around 29,650 and under the short-term trendline push.
- Yesterday’s candle was weak and today hasn’t reclaimed much.
- It’s not breaking down hard, but unlike DAX / FTSE / S&P it isn’t holding a clean higher-high continuation.
- Price is basically trapped between the pivot / moving averages and nearby resistance.
- I’d call this neutral-to-slightly bearish unless it can reclaim 30,025+.
- If it stays below the pivot / 30k area, I’d expect more chop or underperformance versus the other indices.
S&P 500
- Bias: bullish, but slightly extended
- The S&P still looks healthy.
- Price is above the EMA25 / EMA200 cluster and above the rising trend structure.
- The daily structure from the 26 June low is still a sequence of higher lows and higher highs.
- It’s consolidating near the pivot after a good run higher, which is fine in trend terms.
- The “safe zone” / momentum overlay still points higher.
- Still bullish above 7,490.
- The cleaner play is buying a dip into 7,490–7,455 rather than buying a flat open at the highs.
Gold
- Bias: bullish for now, but still within a bigger recovery phase
- Gold has improved a lot versus the earlier bearish structure.
- It has now put in three strong green sessions out of four and is pushing above the pivot / EMA25 area.
- Today’s candle is another strong green candle and price is pushing into the R1 / R2 zone.
- It’s still below the EMA200 and longer-term overhead supply, so I wouldn’t call it a major trend reversal yet.
- But for today’s daily bias, the path of least resistance is now up, not down.
- I’d now call gold bullish short term, with the caveat that it’s a recovery leg inside a broader damaged trend structurerather than a clean long-term breakout.
Interested in how to start trading the FTSE 100? Frequently Asked Questions on Spread betting
Recommended Broker for trading - MT4/5, web and mobile

IC Markets - offers market leading pricing and trading conditions by providing clients with True ECN Connectivity; this allows you to trade on institutional grade liquidity from the world’s leading investment banks, hedge funds and dark pool liquidity execution venues. Highly recommended!
Join my Membership for Trading Tips, Support and Resistance Levels with Live Trading
If you would like more detailed analysis for FTSE 100, DAX40, Gold and the S&P500, including the trades that I am looking to take myself, then please join my active members community.
Keep up to date with new website posts, free sign up below
