
Technical analysis for 20th January 2026
FTSE100 Bias
- Bullish, but Pullback Risk
- Structure: Still in a rising channel
- Price: Holding above EMA25/EMA200, but rejected near upper channel / R1-R2 zone
- RSI: Elevated, rolling over slightly → momentum cooling
- Bias: Bullish → Neutral-Bullish intraday
- Plan:
- Buy dips toward S1 / channel midline
- Profit-taking / short scalp near R1–R2 / upper channel
S&P500 Bias
- Bearish / Corrective Phase
- Structure: Slipping down inside broader channel
- Price: Below EMA25, hovering near S1–S2 zone
- RSI: Weak and drifting lower
- Bias: Bearish → Neutral if S2 holds
- Plan:
- Short rallies into Pivot / R1
- Watch for support bounce at S2 for potential countertrend long
DAX40 Bias
- Bearish Short-Term / Trend Under Pressure
- Structure: Breakdown from mid-channel, now sitting near S1–S2
- Price: Below EMA25, testing lower trend support
- RSI: Weak, sub-50 = bearish momentum
- Bias: Bearish
- Plan:
- Sell rallies into Pivot / EMA25 / channel mid
- Only flip bullish if price reclaims pivot and holds above EMA25
FTSE100 Roadmap
- Below 10,200: Rallies are sells
- At 10,030–10,000: Watch for buyers
- Below 10,000: Daily trend weakens → deeper pullback risk
FTSE100 Likely Path
- Early: Attempted bounce into 10,200–10,230
- Mid-session: Rejection → test of 10,100
- Later: Either
- Base & bounce from 10,030–10,000
- Or acceptance lower → continuation pullback
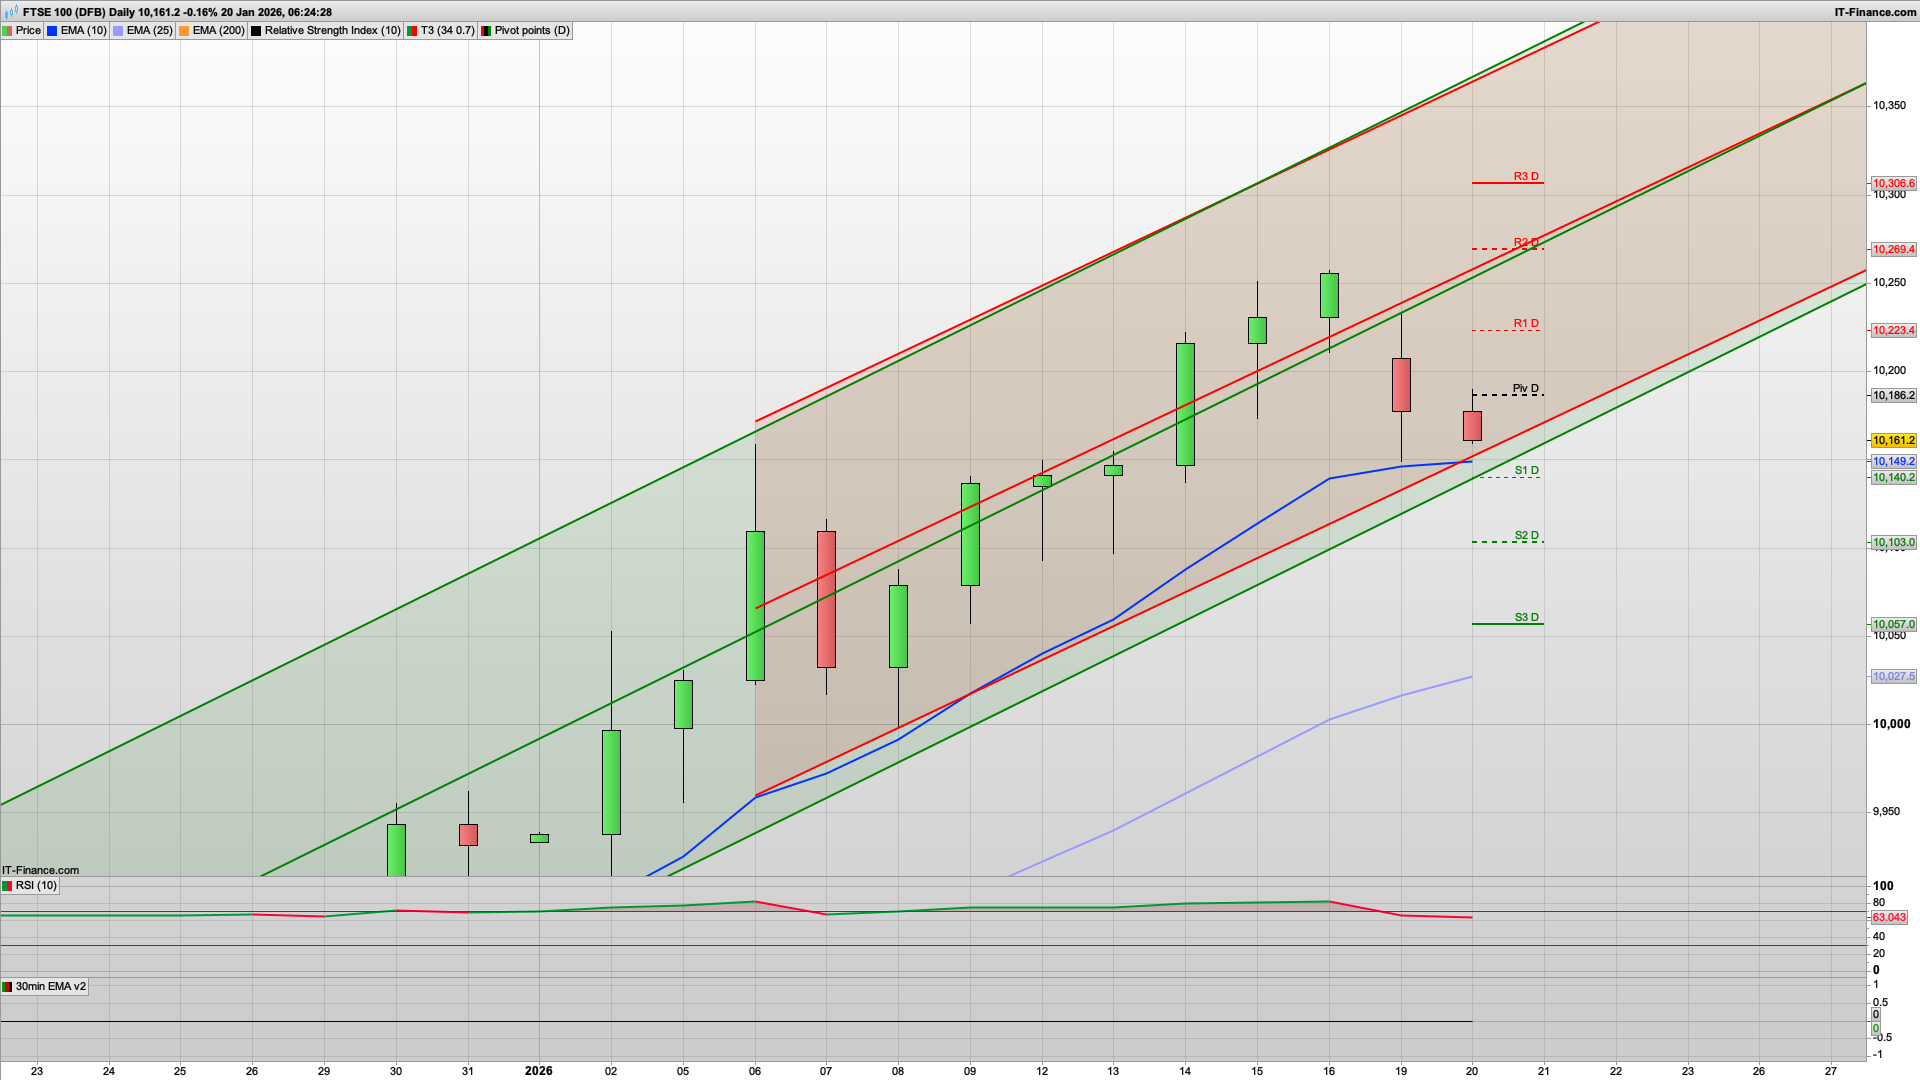
I am still running a portion of the 10222 FTSE100 short, and have just taken some more off at 10140. We may well see a similar pattern today with a rise and dip as a bear Tuesday plays out given the negative backdrop currently. The US returns from their public holiday which may well help the initial kick up to start with, and the S&P500 will be looking to hold S1 at 6850 level. That may well then help the FTSE100 put in a rise towards the 10186 daily pivot which should act as resistance this morning.
We are just on S1 as I write this at 10140 so if the bulls were to defend this the a rise towards that pivot would make sense. If the bulls were to break above the pivot then look for a test of R1 at 10223, conveniently at yesterday's high area so strong resistance. I am expecting a bear Tuesday today though, especially as gold has already shot out the blocks and pushed above R3 this morning.
Below S1 then look for a test of 10103 S2, just below the 10113 key fib level and just above the next key daily support at 10097. As such, a bounce here would fit the chart well, and also give us a snap back into the Raff channels as we are just breaking below both this morning around 10140 as you can see on the daily chart below.
All the 2h charts are bearish as you would expect so we remain in sell the rallies mode for the moment and look for the 6900 resistance for the S&P500 and 25000 for the DAX40.
Good luck today.
Interested in how to start trading the FTSE 100? Frequently Asked Questions on Spread betting
Recommended Broker for trading - MT4/5, web and mobile

IC Markets - offers market leading pricing and trading conditions by providing clients with True ECN Connectivity; this allows you to trade on institutional grade liquidity from the world’s leading investment banks, hedge funds and dark pool liquidity execution venues. Highly recommended!
Join my Membership for Trading Tips, Support and Resistance Levels with Live Trading
If you would like more detailed analysis for FTSE 100, DAX40, Gold and the S&P500, including the trades that I am looking to take myself, then please join my active members community.
Keep up to date with new website posts, free sign up below
