
Technical analysis for 22nd June 2026
Asian share markets swung higher on Monday as Iranian negotiators said progress had been made in peace talks with the United States, helping calm fears the process was breaking down. Officials from Qatar and Pakistan also released a statement saying the first session of talks had concluded and progress was made on a roadmap to reach a final deal in 60 days.
The overall picture today is risk-on for US equities, mixed for Europe, and Gold is attempting a relief bounce but remains in a broader downtrend.
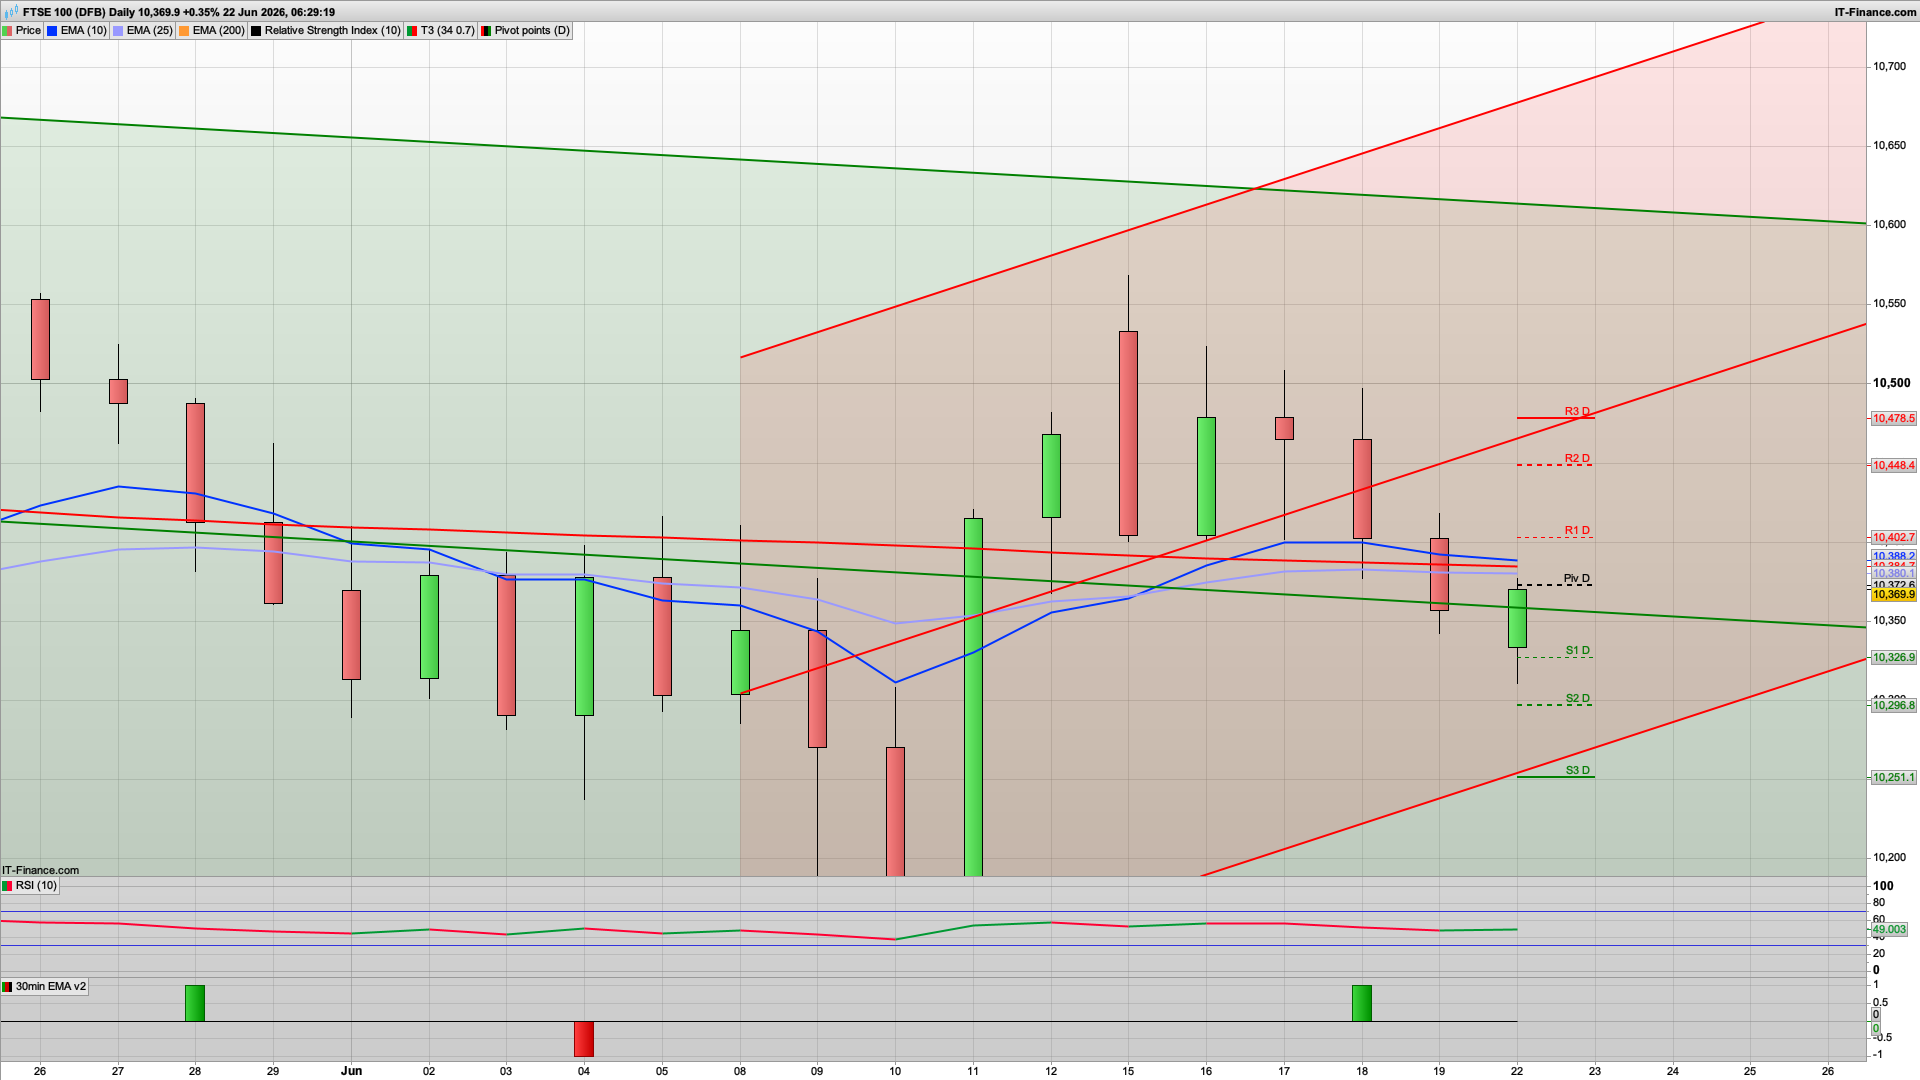
FTSE 100
- Bias: Neutral / Slightly Bearish
- Technical Picture
- Trading below EMA25 and EMA200 cluster.
- Recent candles show indecision.
- Relative weakness versus US indices.
- Sitting around pivot.
- Key Levels
- Resistance:
- 10,402 (R1)
- 10,448 (R2)
- 10,479 (R3)
- Support:
- 10,327 (S1)
- 10,297 (S2)
- 10,251 (S3)
- Resistance:
- Trading Plan
- Above 10,400 turns bullish.
- Below 10,325 opens downside.
DAX 40
- Bias: Bullish
- Technical Picture
- Trading above both EMA25 and EMA200.
- Price remains inside the rising channel.
- Holding above the daily pivot (25,021).
- RSI around 58 and rising.
- Key Levels
- Resistance:
- 25,151 (R1)
- 25,308 (R2)
- 25,437 (R3)
- Support:
- 24,864 (S1)
- 24,851 EMA25
- 24,734 (S2)
- Resistance:
- Trading Plan
- Buy pullbacks above 24,900
- Targets
- 25,150
- 25,300
- 25,430
Nasdaq 100
- Bias: Strong Bullish
- Technical Picture
- Strong uptrend intact.
- EMA25 rising sharply.
- Price holding comfortably above moving averages.
- Small consolidation under recent highs.
- Key Levels
- Resistance:
- 30,428 (R1)
- 30,563 (R2)
- 30,744 (R3)
- Support:
- 30,112 (S1)
- 30,034 EMA25
- 29,930 (S2)
- Resistance:
- Trading Plan
- Buy dips while above 30,100
- Targets
- 30,430
- 30,560
- 30,740
S&P 500
- Bias: Mild Bullish
- Technical Picture
- Holding above EMA25.
- Price sitting directly on pivot.
- Trend structure still positive.
- Momentum stabilising after recent weakness.
- Key Levels
- Resistance:
- 7,501 (R1)
- 7,524 (R2)
- 7,549 (R3)
- Support:
- 7,453 (S1)
- 7,428 (S2)
- 7,405 (S3)
- Resistance:
- Trading Plan
- Buy dips above 7,450
Gold
- Bias: Bearish (despite today's bounce)
- Technical Picture
- Still below EMA25 and EMA200.
- Lower highs and lower lows remain intact.
- Current green candle looks corrective rather than trend-changing.
- Trading beneath major resistance zone around 4,250–4,290.
- Key Levels
- Resistance:
- 4,202 (R1)
- 4,249 (R2)
- 4,290 (R3)
- Support:
- 4,115 (S1)
- 4,075 (S2)
- 4,028 (S3)
- Resistance:
- Trading Plan
- Sell rallies into resistance
- Targets
- 4,115
- 4,075
Other Trades for Today
- Highest Probability Long
- Nasdaq 100
- Buy pullbacks above 30,100
- Target 30,430 → 30,560
- Secondary Long
- DAX
- Buy pullbacks above 24,900
- Target 25,150 → 25,300
- Highest Probability Short
- Gold
- Sell rallies below 4,250
- Target 4,115 → 4,075
Overall Market Theme
Today's charts suggest a bullish equity session with US markets leading, while Gold remains vulnerable to further selling. The FTSE continues to lag and is the weakest equity index of the group. If I had to choose only one directional trade from these daily charts, it would still be Nasdaq long, with Gold short as the best counter-trend opportunity.
FTSE 100
The overnight recovery suggests sellers are losing control after Friday's weakness. The highest-probability trade today is buying dips while price remains above S1 (10,327) and looking for a move back into R1 (10,403) and potentially R2 (10,448). A break below S1 would negate the bullish outlook and reopen downside toward 10,297.
Interested in how to start trading the FTSE 100? Frequently Asked Questions on Spread betting
Recommended Broker for trading - MT4/5, web and mobile

IC Markets - offers market leading pricing and trading conditions by providing clients with True ECN Connectivity; this allows you to trade on institutional grade liquidity from the world’s leading investment banks, hedge funds and dark pool liquidity execution venues. Highly recommended!
Join my Membership for Trading Tips, Support and Resistance Levels with Live Trading
If you would like more detailed analysis for FTSE 100, DAX40, Gold and the S&P500, including the trades that I am looking to take myself, then please join my active members community.
Keep up to date with new website posts, free sign up below
