
Technical analysis for 19th June 2026
Today the charts have become noticeably more defensive than yesterday. We're seeing rejection candles in equities and a sharp breakdown in Gold.
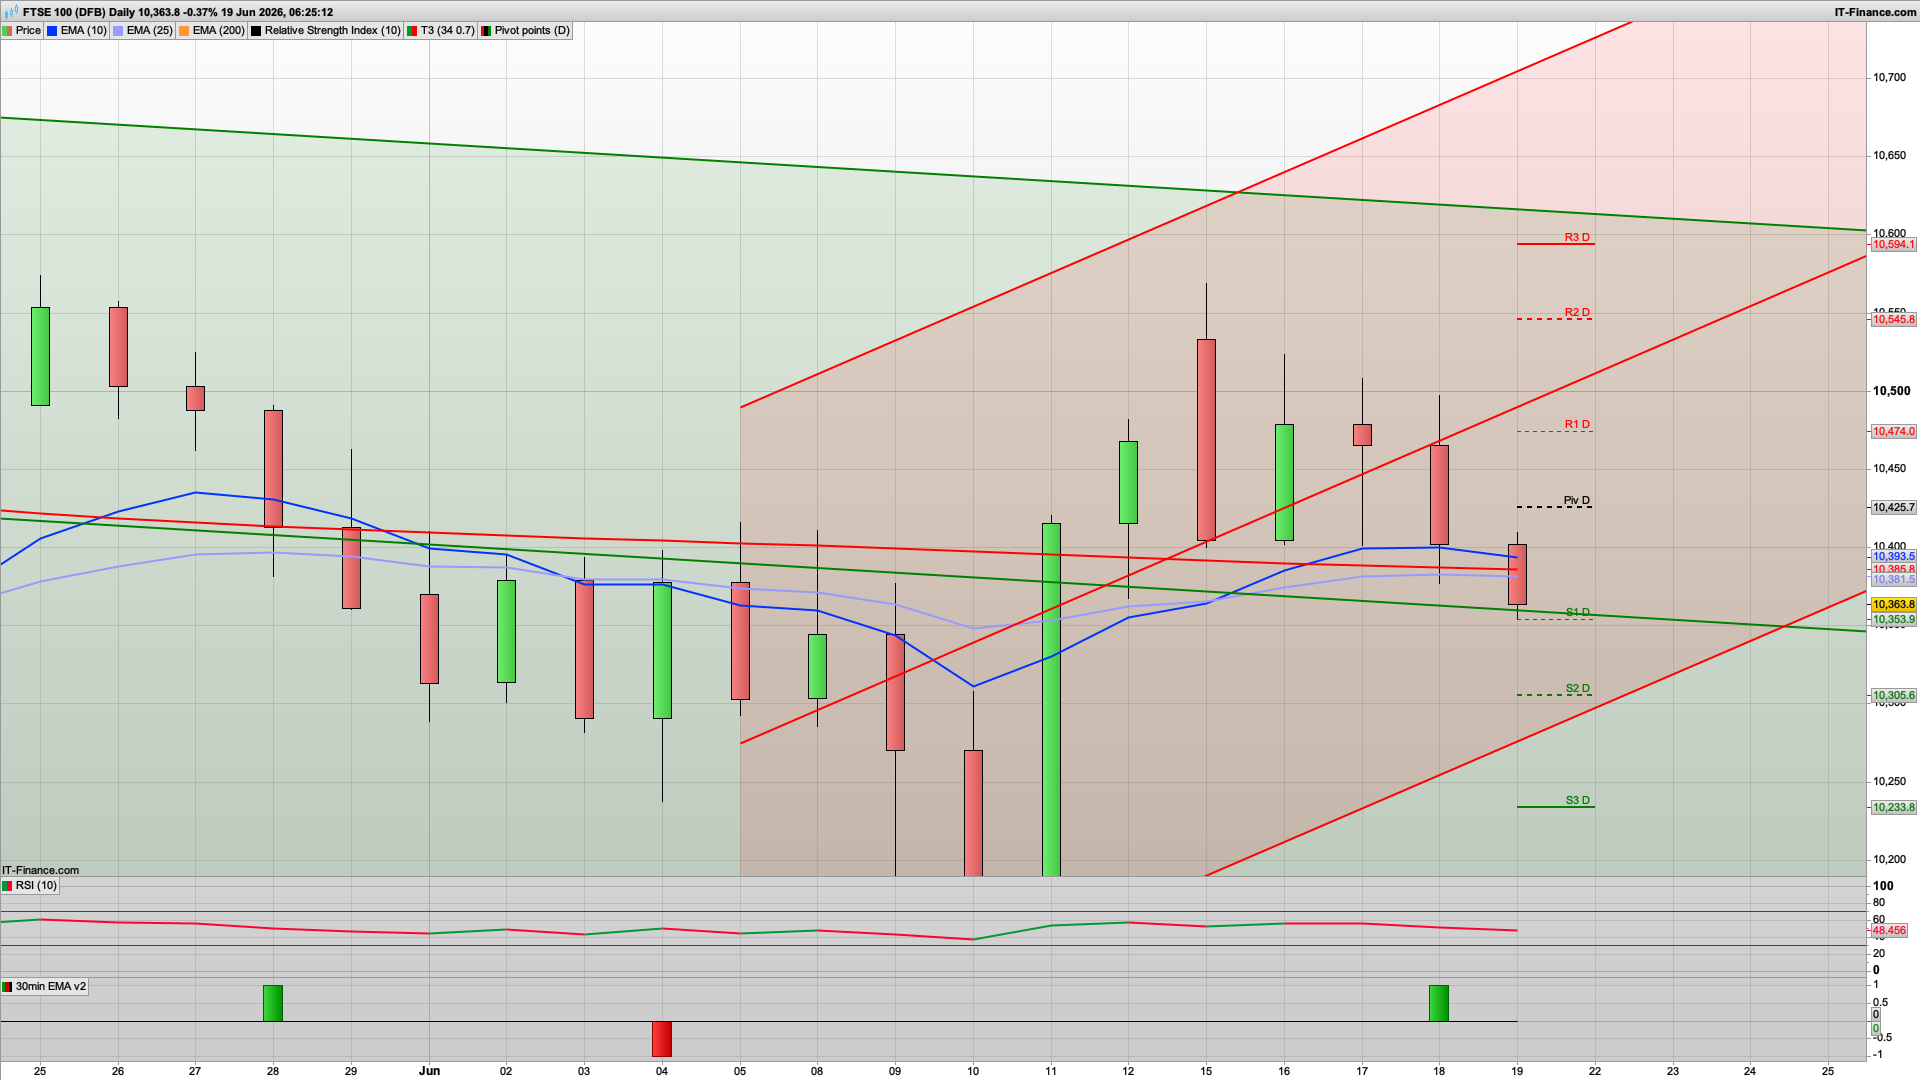
FTSE 100
- Bias: Bearish
- Clear rejection from the upper channel.
- Back below EMA25 and EMA200 cluster.
- Consecutive lower highs forming.
- RSI weakening.
- Key Levels
- Resistance:
- 10,393–10,400 EMA zone
- 10,474 (R1)
- Support:
- 10,354 (S1)
- 10,306 (S2)
- 10,234 (S3)
- Resistance:
- Trading View
- Sell rallies into 10,390–10,420.
- A break below 10,350 could accelerate downside.
DAX 40
- Bias: Neutral to Slightly Bearish
- Yesterday's candle rejected the upper rising channel.
- Current price sitting below the daily pivot (24,999).
- EMA25 remains rising, so trend isn't broken.
- Momentum has stalled near the psychological 25,000 area.
- Key Levels
- Resistance:
- 24,999 (Pivot)
- 25,160 (R1)
- 25,277 (R2)
- Support:
- 24,882 (S1)
- 24,721 (S2)
- 24,604 (S3)
- Resistance:
- Trading View
- Below 25,000 I favour selling rallies.
- Above 25,050 the bullish trend resumes.
Nasdaq 100
- Bias: Neutral Bullish
- Still inside a strong rising channel.
- EMA25 continues higher.
- Several indecision candles around 30,200.
- No significant selling pressure yet.
- Key Levels
- Resistance:
- 30,445 (R1)
- 30,694 (R2)
- 30,928 (R3)
- Support:
- 29,963 (S1)
- 29,789 (S2)
- Resistance:
- Trading View
- Bulls remain in control while above 29,950.
- Market appears to be consolidating rather than reversing.
S&P 500
- Bias: Neutral to Slight Bearish
- Three consecutive red candles.
- Price has slipped below EMA25.
- Momentum indicator rolling over.
- Testing support around 7,450.
- Key Levels
- Resistance:
- 7,481 Pivot
- 7,501 R1
- 7,533 R2
- Support:
- 7,449 S1
- 7,428 S2
- 7,397 S3
- Resistance:
- Trading View
- Below 7,480 sellers have the edge.
- Break under 7,450 could trigger a move toward 7,400.
Gold
- Bias: Strong Bearish
- Large bearish breakdown candle.
- Trading below EMA25.
- Broke pivot support decisively.
- Momentum has turned sharply negative.
- Key Levels
- Resistance:
- 4,246 Pivot
- 4,291 R1
- 4,374 R2
- Support:
- 4,163 S1
- 4,118 S2
- 4,035 S3
- Resistance:
- Trading View
- Rallies should be sold while below 4,246.
- 4,118 is the next obvious downside target.
Other Opportunities Today
- Long Setup
- Nasdaq 100
- Buy pullbacks above 29,950
- Targets: 30,445 → 30,694
- Nasdaq 100
- Short Setup
- FTSE 100
- Sell rallies into 10,390–10,420
- Targets: 10,350 → 10,305
- FTSE 100
- Strongest Short
- Gold
- Sell rallies below 4,246
- Targets: 4,163 → 4,118
- Gold
Overall Daily Theme
Today's charts suggest a risk-off rotation compared with earlier in the week. The Nasdaq remains the strongest index and is still technically bullish, but the FTSE and Gold are showing clear deterioration. If I were choosing only one index to trade today, I would still favour Nasdaq longs on dips and Gold shorts on rallies.
Good luck today and have a great weekend!
Interested in how to start trading the FTSE 100? Frequently Asked Questions on Spread betting
Recommended Broker for trading - MT4/5, web and mobile

IC Markets - offers market leading pricing and trading conditions by providing clients with True ECN Connectivity; this allows you to trade on institutional grade liquidity from the world’s leading investment banks, hedge funds and dark pool liquidity execution venues. Highly recommended!
Join my Membership for Trading Tips, Support and Resistance Levels with Live Trading
If you would like more detailed analysis for FTSE 100, DAX40, Gold and the S&P500, including the trades that I am looking to take myself, then please join my active members community.
Keep up to date with new website posts, free sign up below
