
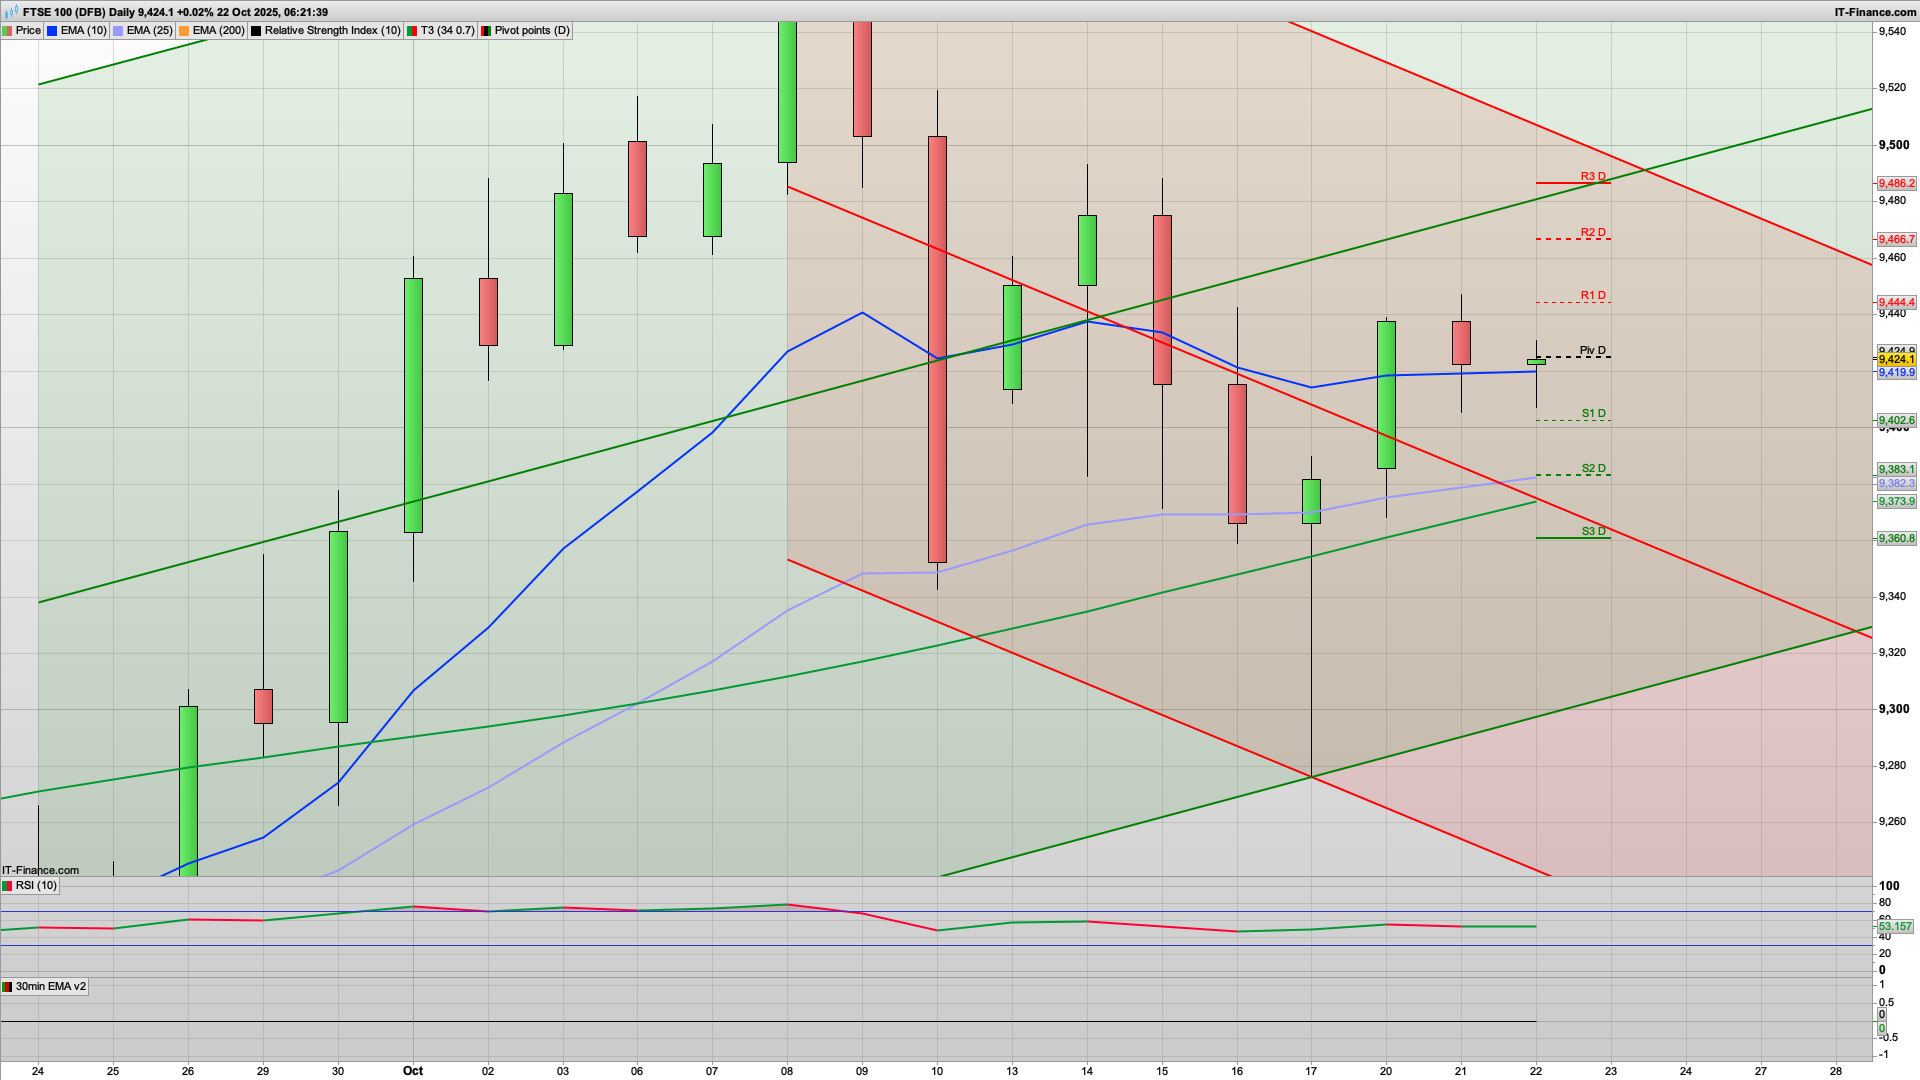
Technical analysis for 22nd October 2025
A bit lacklustre yesterday for the FTSE100 though the long netted a few points. Today we have the inflation figures out with a forecast of 4%, though in the real world it's probably even higher than that! The 2h chart remains bullish so my bias is still long, with the 9400 level the key Hull MA support so I am looking for this to hold today. If the bulls can break above the daily pivot at 9425 and the 9428 red 30m coral then we should see a rise towards the 9466 R2 level, and of course the round number 9500 above that. 9486 is R3, and we have the key fib at 9483 so look for any rise to falter in this zone.
Following yesterdays consolidation sort of day, we may well see the bulls reappear today, especially as we are cycling out of gold which had a 6% drop yesterday and would suggest that indices have a way to run still. A mentioned yesterday we may well have seen the Santa Rally start this week.
If the bears were to break below the 9400 level then 9360 looks the key support with S3 and also the key fib here, though as that will have broken the Hull MA also, the bears will certainly be looking to build that momentum - though they are on the back foot at the moment.
Bias Summary
- Short-term (intraday): Bullish bias above 9,421, watching for breakout through 9,445–9,450.
- Medium-term (multi-day): Still range-bound / corrective, with upside limited near 9,480–9,500 unless there’s strong volume and sentiment shift.
- Invalidation: A move back below 9,400 turns the bias neutral-to-bearish, suggesting another test of 9,380 → 9,360 support.
DAX40
Again the 2h chart is bullish with support at 24200 (and rising) and this is just below the S1 and 30m 200ema levels so if we get an initial drop I would like to see any test of this area hold. The bulls will be looking to break above the 24350 level where we have the red 30m coral, as that would open up a likely rise towards the 24412 R1 level and then 24456 key fib above that. Below the 24200 level then the bears will be aiming for the 24128 key fib, and with S2 also at 24120 look for a bounce at this level.
S&P500
The 6740 level is support to start with as we have the daily pivot and the 30m 25ema here, along with the 6725 Hull MA on the 2h chart. As such a rise from this area to test the 6756 R1 level would make sense, and then the 6769 R2 level above that. If the bears were to break the daily pivot then we may well see a drop down to the 6700 area where we have S3, the key fib, and the 30m 200ema. Generally remains bullish for the time being.
Good luck today.
Interested in how to start trading the FTSE 100? Frequently Asked Questions on Spread betting
Recommended Broker for trading - MT4/5, web and mobile

IC Markets - offers market leading pricing and trading conditions by providing clients with True ECN Connectivity; this allows you to trade on institutional grade liquidity from the world’s leading investment banks, hedge funds and dark pool liquidity execution venues. Highly recommended!
Membership, Trading Tips, Support and Resistance Levels with Live Trading
If you would like more detailed analysis for FTSE 100, DAX40, Gold and the S&P500, including the trades that I am looking to take myself, then please join my active members community.
Keep up to date with new website posts, free sign up below
