
Technical analysis for 14th July 2026
We head into Tuesday with the geopolitical situation once again firmly in control of the markets. Oil has pushed to a one-month high as the fighting between the US and Iran intensifies around the Strait of Hormuz. The latest threat of a 20% charge on cargo moving through the Strait has added another layer of uncertainty to an already fragile situation. Brent crude is now trading around the $85 area and that is bringing the inflation problem straight back into focus.
Asian markets have been hit hard overnight, European futures are pointing lower and US futures remain under pressure following yesterday's sell-off on Wall Street. The S&P 500 fell nearly 0.8% yesterday as technology shares weakened and oil surged more than 9%.
So once again we have the same problem facing the markets.
- Higher oil.
- Higher inflation expectations.
- Higher bond yields.
- And potentially higher interest rates.
We also have US inflation data and Fed Chair Kevin Warsh speaking to Congress today, so I think volatility could remain elevated throughout the session.
I think the picture has improved slightly from yesterday. The S&P remains the strongest market, Nasdaq is trying to recover, while Gold remains the weakest chart. DAX and FTSE are more neutral and need a break from their current compression.
FTSE 100 — NEUTRAL / SLIGHTLY BEARISH
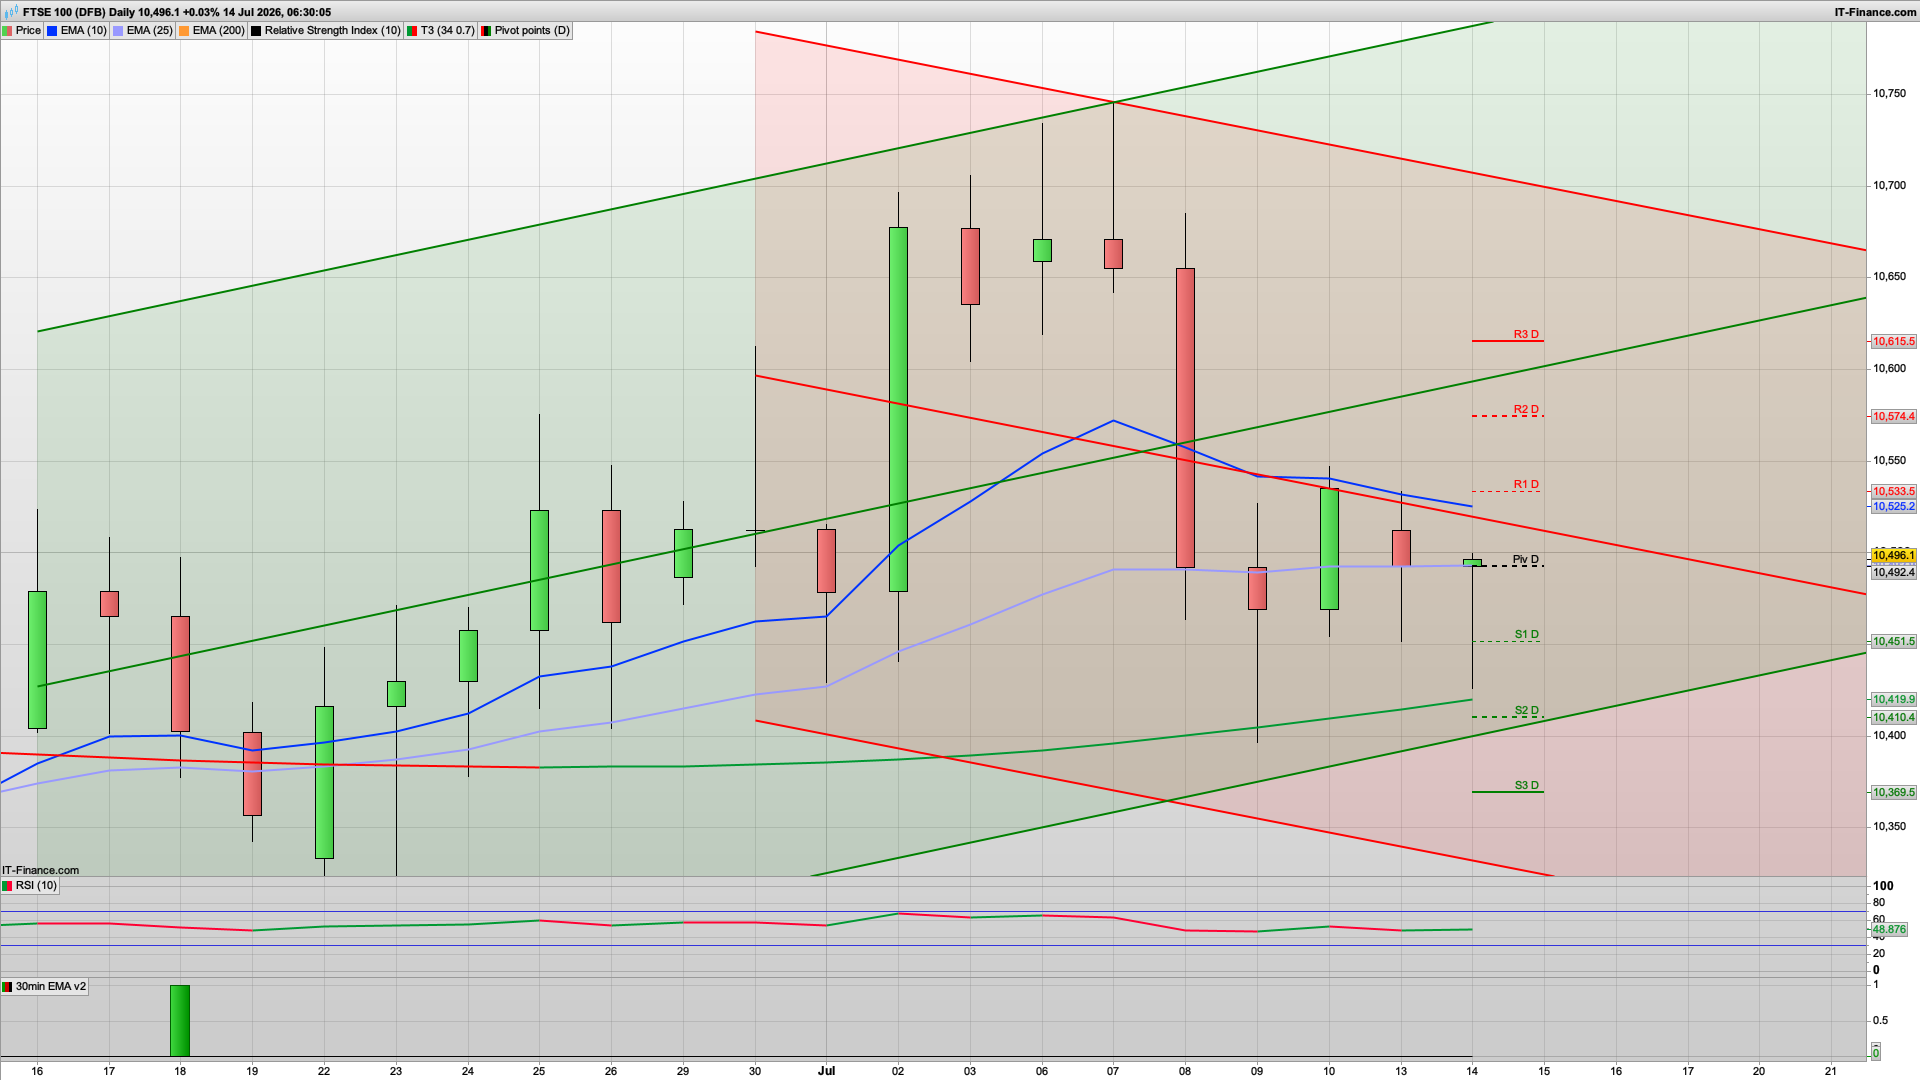
- The FTSE is frustratingly compressed.
- Price is sitting almost directly on the daily pivot around 10,492, while the EMA25 is also nearby.
- The EMA10 at 10,525 is falling and price remains below the descending red resistance line.
- That keeps the short-term bias slightly bearish.
- The key resistance zone is 10,525–10,535.
- If the FTSE rejects that area, I would favour a move back towards 10,451 S1, followed by 10,419–10,410.
- However, a break above 10,535 changes the picture and could quickly squeeze towards 10,574 R2.
- I wouldn't chase the FTSE at the current level. I would wait for the reaction at 10,525–10,535.
DAX 40 — NEUTRAL / SLIGHT BULLISH
- The DAX is attempting to stabilise after the sharp sell-off from the 25,800 area. Price is now around 25,006, sitting just above the 24,967 daily pivot and close to the EMA200 at 25,035.
- The interesting feature is that buyers continue to defend the rising green channel support around 24,900–24,925. Yesterday's lower wick and today's early green candle suggest sellers are struggling to extend the move lower.
- However, the EMA10 around 25,137 and descending red trend resistance around 25,150–25,180 remain overhead.
- My preference is to buy confirmed weakness towards 24,920–24,970, targeting 25,137, then 25,159 R1.
- Below 24,900, the bullish idea weakens considerably and opens 24,779 S1, followed by 24,587.
Nasdaq 100 — SLIGHTLY BULLISH
- Nasdaq has produced a decent recovery candle from the lower part of the descending channel.
- Price is now around 29,423 and has recovered above the daily pivot at approximately 29,301.
- That's a positive development.
- The problem is the index remains beneath the EMA cluster at 29,504–29,547, so there is still substantial resistance directly overhead.
- My preferred scenario is a continuation higher towards 29,500–29,550.
- If price breaks and holds above that zone, 29,788 R2 becomes possible.
- The key support is 29,300. While above that level, I favour buying dips.
- Below 29,300, the chart turns bearish again with 29,016 S1 the next obvious target.
S&P 500 — BULLISH
- The S&P is still my strongest chart today.
- Yesterday's weakness has been bought and price has recovered above the 7,517 daily pivot. The index also remains above the EMA10 at approximately 7,509 and well above the EMA25 at 7,475.
- Structurally, the rising channel remains intact.
- The immediate target is the resistance cluster around 7,547–7,552.
- A clean break above that area should open 7,595 R2, with 7,625 R3 beyond.
- My preferred trade is buying a dip into 7,510–7,520, provided that area holds on the 30-minute chart.
- The bearish trigger would be a sustained break below 7,500. That would expose 7,475–7,469.
- This is my preferred long market today.
Gold — BEARISH
- Gold remains the weakest chart of the five.
- Price is around 4,025, below the EMA10 at 4,080 and beneath the daily pivot around 4,026.
- More importantly, the broader descending channel remains intact.
- Yesterday's sharp drop through the 4,065 area was technically bearish. Today's bounce looks corrective at this stage.
- My preferred scenario is to sell a bounce.
- The first resistance area is 4,026–4,040. Above there, 4,066 R1 is the stronger resistance zone.
- I would favour selling a confirmed rejection from either area.
- Downside targets are 3,961 S1, then 3,922 S2.
- A sustained move above 4,080 would make me reconsider the bearish bias.
- This is my preferred short market today.
My two clearest directional ideas
- LONG: S&P 500 — I favour buying a confirmed hold around 7,510–7,520, targeting 7,547–7,552, then 7,595.
- SHORT: Gold — I favour selling a rejection from 4,026–4,040, or ideally a stronger rally towards 4,066, targeting 3,961, then 3,922.
FTSE 100 Analysis
The FTSE finished yesterday around the 10498 area and was remarkably resilient considering the broader risk-off move.
The main reason for that is oil. The FTSE's heavy exposure to the energy sector means rising crude prices can actually provide support to the index through the likes of BP and Shell. That is exactly what we saw yesterday, with energy strength helping offset weakness elsewhere in the market. However, the FTSE is not completely immune from a global equity sell-off.
European futures are pointing lower this morning and if the DAX and US futures continue to weaken, I think the FTSE will eventually struggle to hold up on energy strength alone.
- What I'm Watching
- The first area I am watching is the recent support around the 10460 area.
- Below that, the 10400 zone becomes increasingly important.
- If we see an early drop into support followed by buyers stepping back in, then the FTSE could once again prove to be the strongest of the major indices.
- The first meaningful resistance is around the 10540 area, with 10585 above that.
- A break and hold above those levels would put the bulls back in control.
- Trading Plan
- I am neutral to slightly bearish initially.
- I don't want to buy the first dip blindly.
- The ideal long setup would be an early sell-off into support followed by a strong bullish reaction and a reclaim of the short-term moving averages.
- If 10460 breaks cleanly and the market starts forming lower highs, then I would be more interested in selling a failed bounce towards the 10400 area.
Final Thoughts
Today looks like another potentially volatile session. The situation in the Strait of Hormuz has put oil firmly back at the centre of the market and the inflation problem is once again becoming impossible for traders to ignore. The FTSE remains relatively resilient thanks to its exposure to the oil majors, but I still want to see buyers confirm support before getting involved on the long side.
The DAX looks the most vulnerable to the energy shock and remains my preferred market for selling failed rallies.
The S&P 500 is under short-term pressure and today's inflation data and Fed testimony could have a significant impact on the next move.
Gold remains fascinating. The fact that it fell almost 3% during a major geopolitical escalation tells us just how powerful the rates and dollar story currently is.
Good luck today.
Interested in how to start trading the FTSE 100? Frequently Asked Questions on Spread betting
Recommended Broker for trading - MT4/5, web and mobile

IC Markets - offers market leading pricing and trading conditions by providing clients with True ECN Connectivity; this allows you to trade on institutional grade liquidity from the world’s leading investment banks, hedge funds and dark pool liquidity execution venues. Highly recommended!
Join my Membership for Trading Tips, Support and Resistance Levels with Live Trading
If you would like more detailed analysis for FTSE 100, DAX40, Gold and the S&P500, including the trades that I am looking to take myself, then please join my active members community.
Keep up to date with new website posts, free sign up below