
Technical analysis for 20th November 2026
Global markets enter the final trading session of the week under considerable pressure as the sell-off in artificial intelligence-related stocks spreads across international equity markets.
The S&P 500 fell more than 2% on Thursday, the Nasdaq suffered another sharp decline, and the FTSE 100 and DAX both extended their recent losses. Asian markets have continued falling overnight, while the US dollar remains close to a 19-month high.
Investors are increasingly questioning whether the substantial investment in AI infrastructure can deliver the returns needed to justify elevated technology valuations. At the same time, persistent inflation and expectations of further Federal Reserve tightening are limiting the scope for a sustained recovery.
The immediate focus today is whether markets can stabilise ahead of the weekend or whether the latest selling pressure develops into a deeper correction.
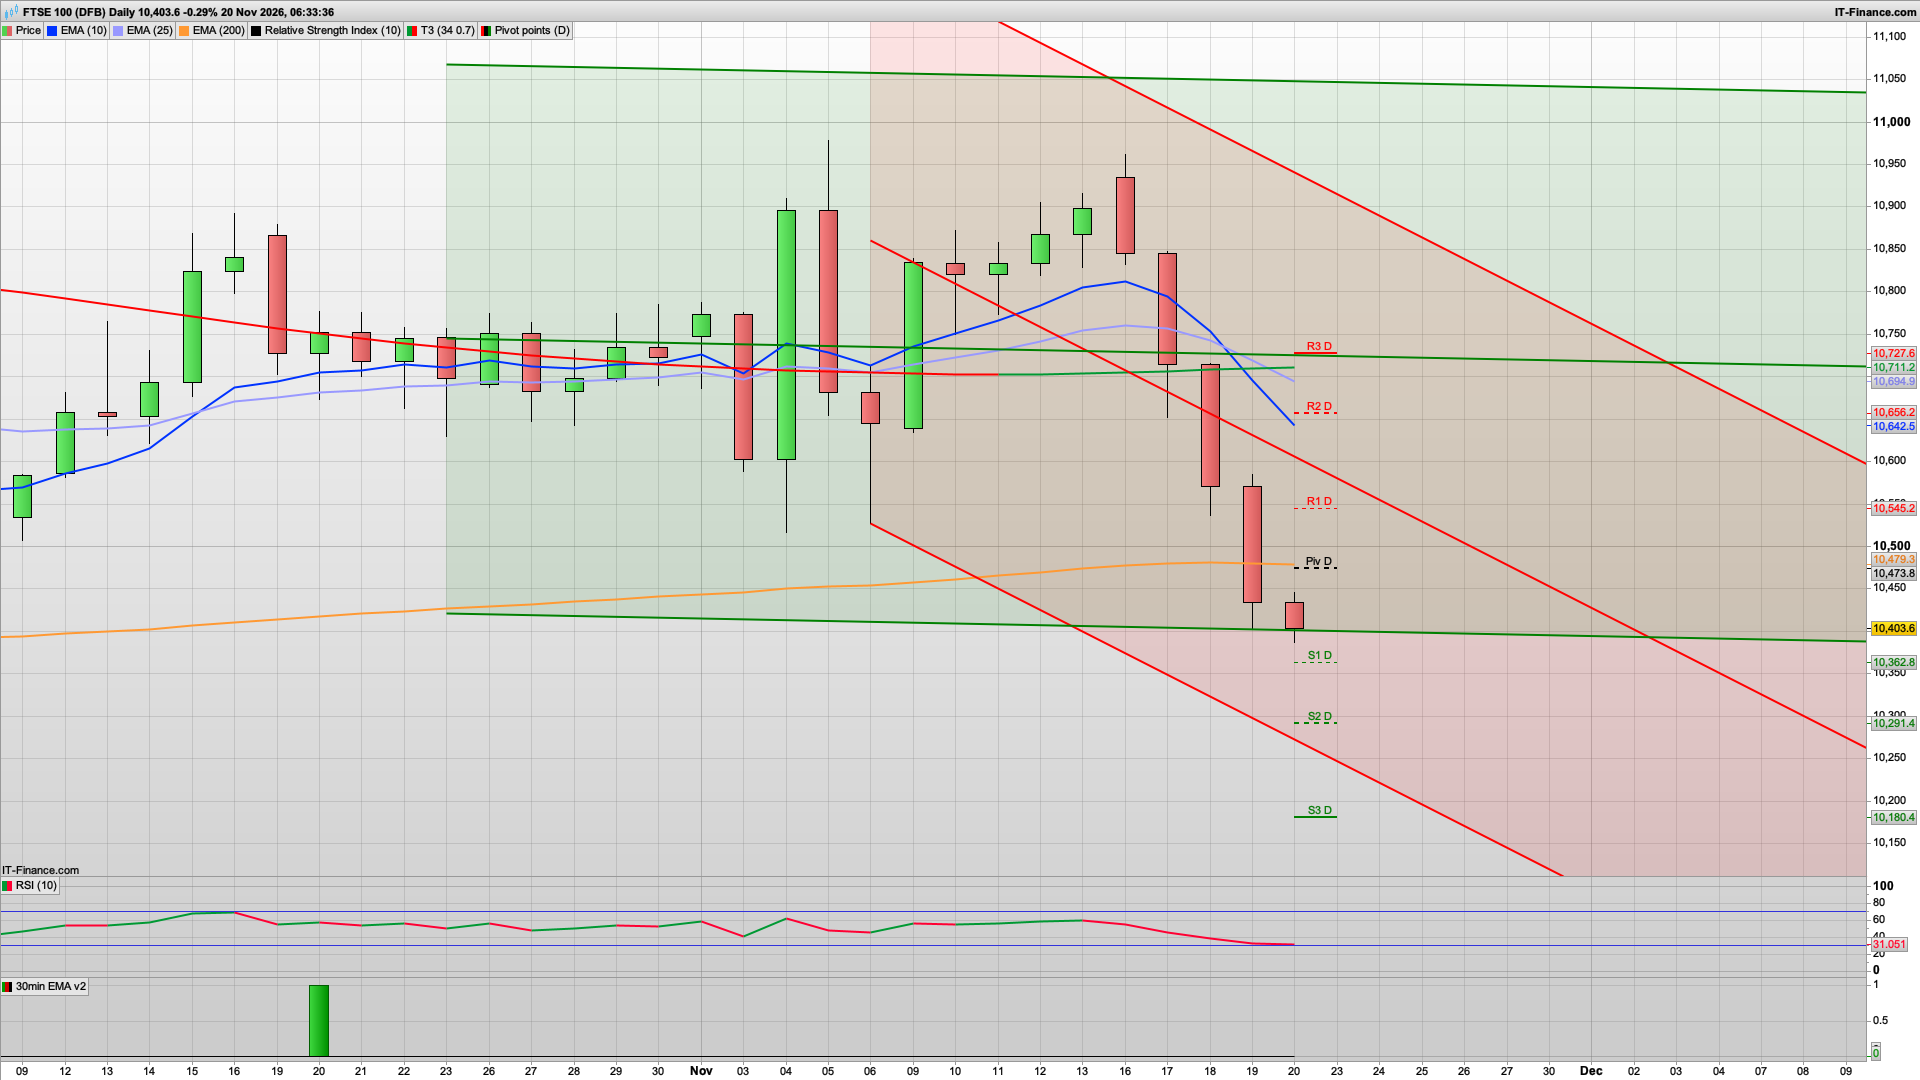
The technical picture has deteriorated substantially since yesterday. The FTSE has fallen another 170 points from yesterday morning's quoted level and is now trading below its daily 10-day, 25-day and 200-day exponential moving averages.
The 30-minute chart shows a persistent sequence of lower highs and lower lows, while the daily RSI has fallen to 30.76, approaching oversold territory.
My prediction today is for a possible early rebound towards 10435-475, followed by renewed selling towards 10363 and potentially 10291 if resistance holds.
However, after such an aggressive decline, the risk of a sharp short-covering rally is elevated. I would not chase a short position at the current price. The key battleground today is 10363 support versus 10474 resistance. A sustained break below 10,363 would strengthen the bearish outlook, while a recovery above 10474 would suggest that the selling pressure is beginning to ease.
Why I'm bearish today
The daily RSI has declined sharply from approximately 38 yesterday to 30.8 today, confirming that selling momentum remains dominant. The daily chart shows price trading below all three key moving averages, with the 10 EMA near 10694, the 25 EMA near 10641 and the 200 EMA near 10479. On the 30-minute chart, price remains beneath the declining moving averages, and overnight attempts to recover have repeatedly failed. The main concern for sellers is that the FTSE is approaching significant support around 10363 and could stage a sharp relief rally before declining further.
For more more analysis including other markets please join...
Interested in how to start trading the FTSE 100? Frequently Asked Questions on Spread betting
Recommended Broker for trading - MT4/5, web and mobile

IC - offers market leading pricing and trading conditions by providing clients with True ECN Connectivity; this allows you to trade on institutional grade liquidity from the world’s leading investment banks, hedge funds and dark pool liquidity execution venues. Highly recommended!
Join my Membership for Trading Tips, Support and Resistance Levels with Live Trading
If you would like more detailed analysis for FTSE 100, DAX40, Gold and the S&P500, including the trades that I am looking to take myself, then please join my active members community.
Keep up to date with new website posts, free sign up below