
Technical analysis for 19th November 2026
Global financial markets enter Thursday under renewed pressure as investors digest persistent inflation, the prospect of further interest-rate increases and growing uncertainty surrounding artificial intelligence valuations.
The FTSE 100 has now fallen for three consecutive sessions, the S&P 500 has recorded its fifth successive decline, and Gold has dropped to its lowest level in more than a year.
Yesterday's Federal Reserve meeting minutes reinforced expectations of further monetary tightening, while UK inflation rose to 3.6% in October, its highest annual reading in a year.
Despite Nvidia reporting exceptionally strong quarterly earnings, investors remain concerned about the sustainability of AI investment and the valuations attached to technology companies.
Today also brings Anthropic's anticipated stock-market debut and a high-profile meeting between the leaders of the United States, China and Russia, both of which could influence global sentiment.
The overriding theme is that strong corporate earnings are no longer sufficient on their own to overcome concerns about inflation, borrowing costs and market valuations.
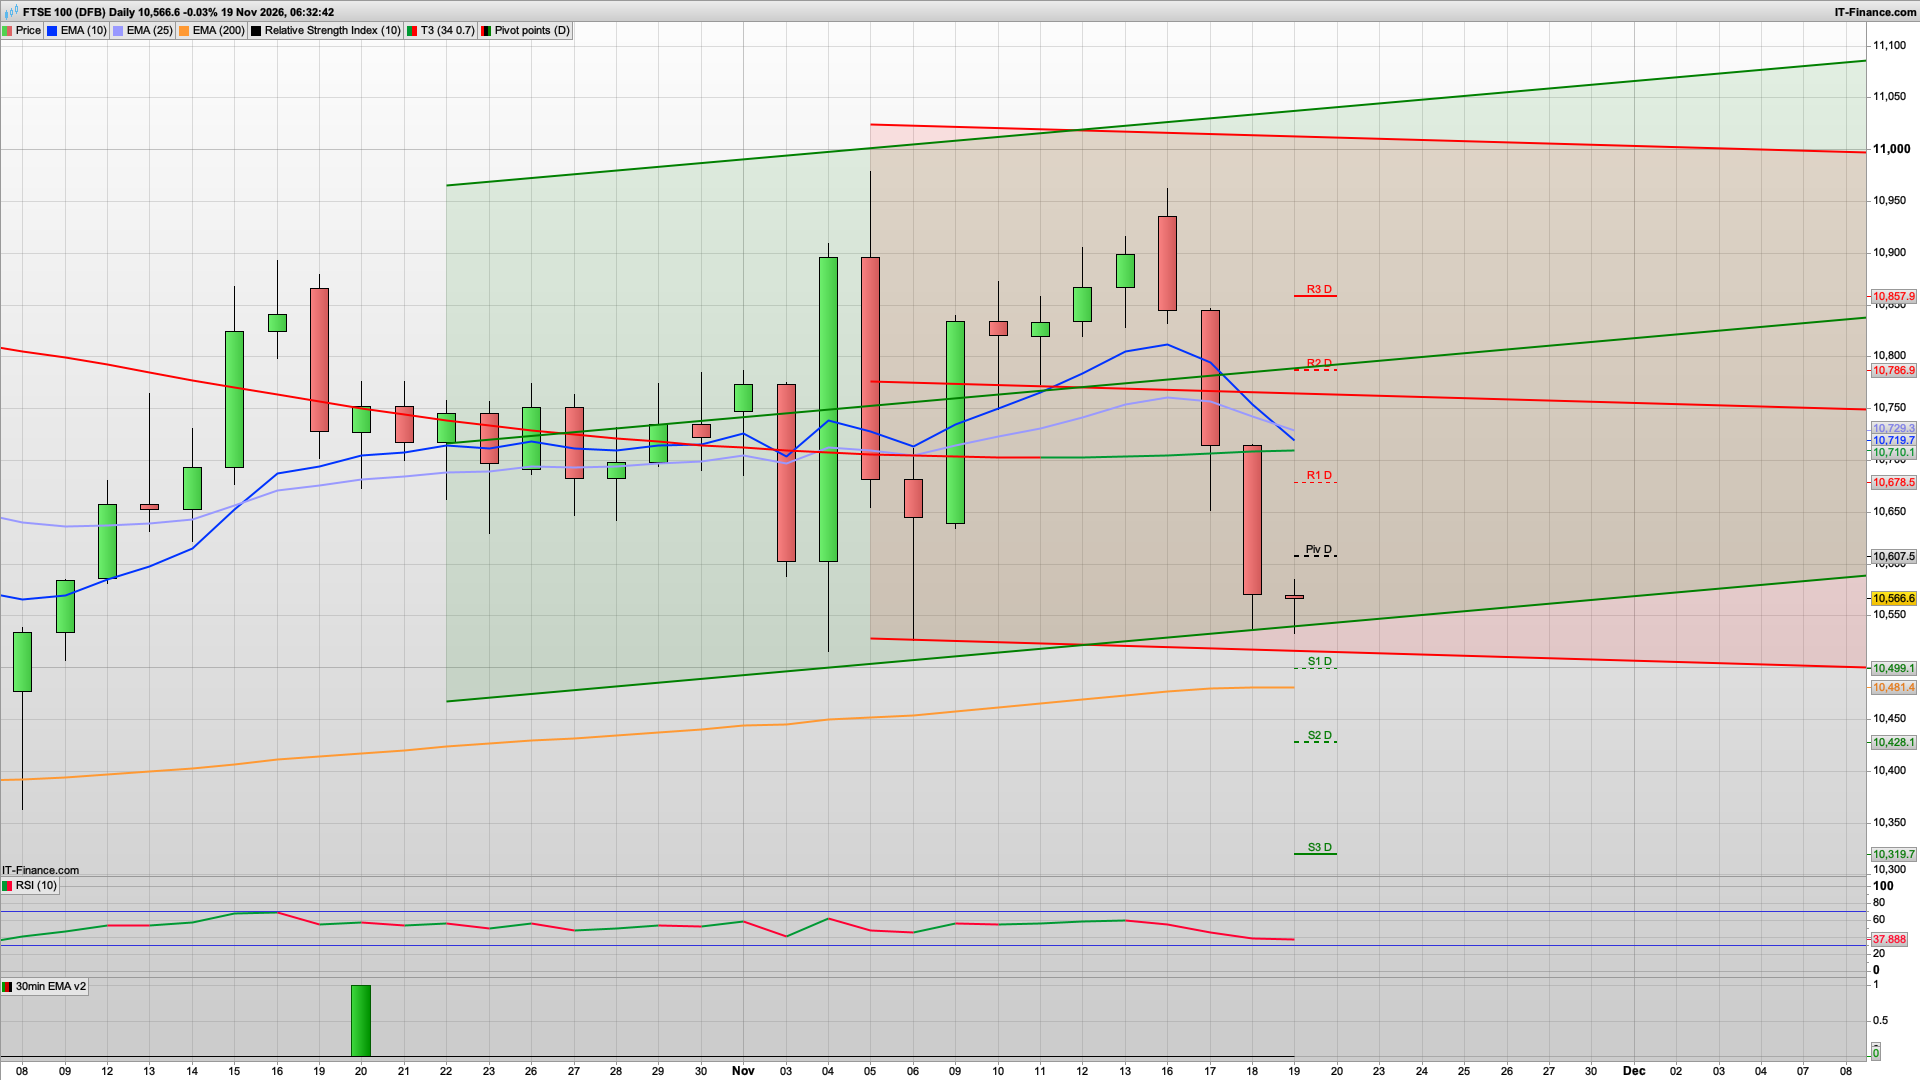
The technical picture remains bearish. Yesterday's decline has pushed the FTSE below its daily 10- and 25-period EMAs, while the daily RSI has fallen to approximately 38, its weakest reading in the recent sequence of charts. However, the index is approaching an important support area around 10500, and the 30-minute chart is beginning to consolidate after a sustained decline.
My prediction today is for a possible early recovery towards 10590-610, followed by renewed selling towards 10500 and potentially 10428 if resistance holds. I favour selling a confirmed recovery rather than chasing the decline immediately. The key battleground initially today is 10500 support versus 10607 resistance.
A sustained break below 10500 would strengthen the bearish outlook, while a recovery above 10607 would suggest that selling pressure is beginning to ease and open up a possible rise as far as R1 at 10678.
With the recent declines the 2h chart is bearish with Hull MA resistance at 10650 so also look for a possible stall of any rise in this area.
For more more analysis including other markets please join...
Interested in how to start trading the FTSE 100? Frequently Asked Questions on Spread betting
Recommended Broker for trading - MT4/5, web and mobile

IC - offers market leading pricing and trading conditions by providing clients with True ECN Connectivity; this allows you to trade on institutional grade liquidity from the world’s leading investment banks, hedge funds and dark pool liquidity execution venues. Highly recommended!
Join my Membership for Trading Tips, Support and Resistance Levels with Live Trading
If you would like more detailed analysis for FTSE 100, DAX40, Gold and the S&P500, including the trades that I am looking to take myself, then please join my active members community.
Keep up to date with new website posts, free sign up below