
Technical analysis for 27th July 2026
Markets are starting the week with a risk-on bias after a pause in hostilities between the US and Iran eased fears of a wider regional conflict. Oil has fallen sharply from last week's highs, taking some pressure off inflation expectations, while bond yields have eased. Investors are now turning their attention to one of the busiest weeks of the year, with the Federal Reserve, Bank of England, and a wave of Big Tech earnings all due over the next few days.
The FTSE 100 remains the clear leader, the DAX has broken above key resistance and is turning constructive, while the Nasdaq remains the weakest of the equity indices despite a small bounce. The S&P 500 is consolidating within its uptrend, and Gold continues to correct lower.
Over the weekend, both the United States and Iran indicated they would pause further military action, providing the market with its first genuine sign of de-escalation in several weeks. The immediate reaction has been exactly what you would expect. Oil has fallen sharply. Bond yields have eased. Equity futures are pointing higher. That doesn't mean the geopolitical risk has disappeared completely. Attacks on Saudi oil infrastructure continue to remind investors that the situation remains fragile, but for now the market has chosen to focus on the prospect of lower energy prices rather than further escalation. Attention now shifts to what could be the most important week of the summer. We have the Federal Reserve interest rate decision, the Bank of England later in the week and earnings from Microsoft, Apple, Amazon and Meta. Those events are likely to determine whether the recent equity rally can resume.
For today, I think the market will welcome the fall in oil prices, but traders are unlikely to become overly aggressive ahead of so many major events.
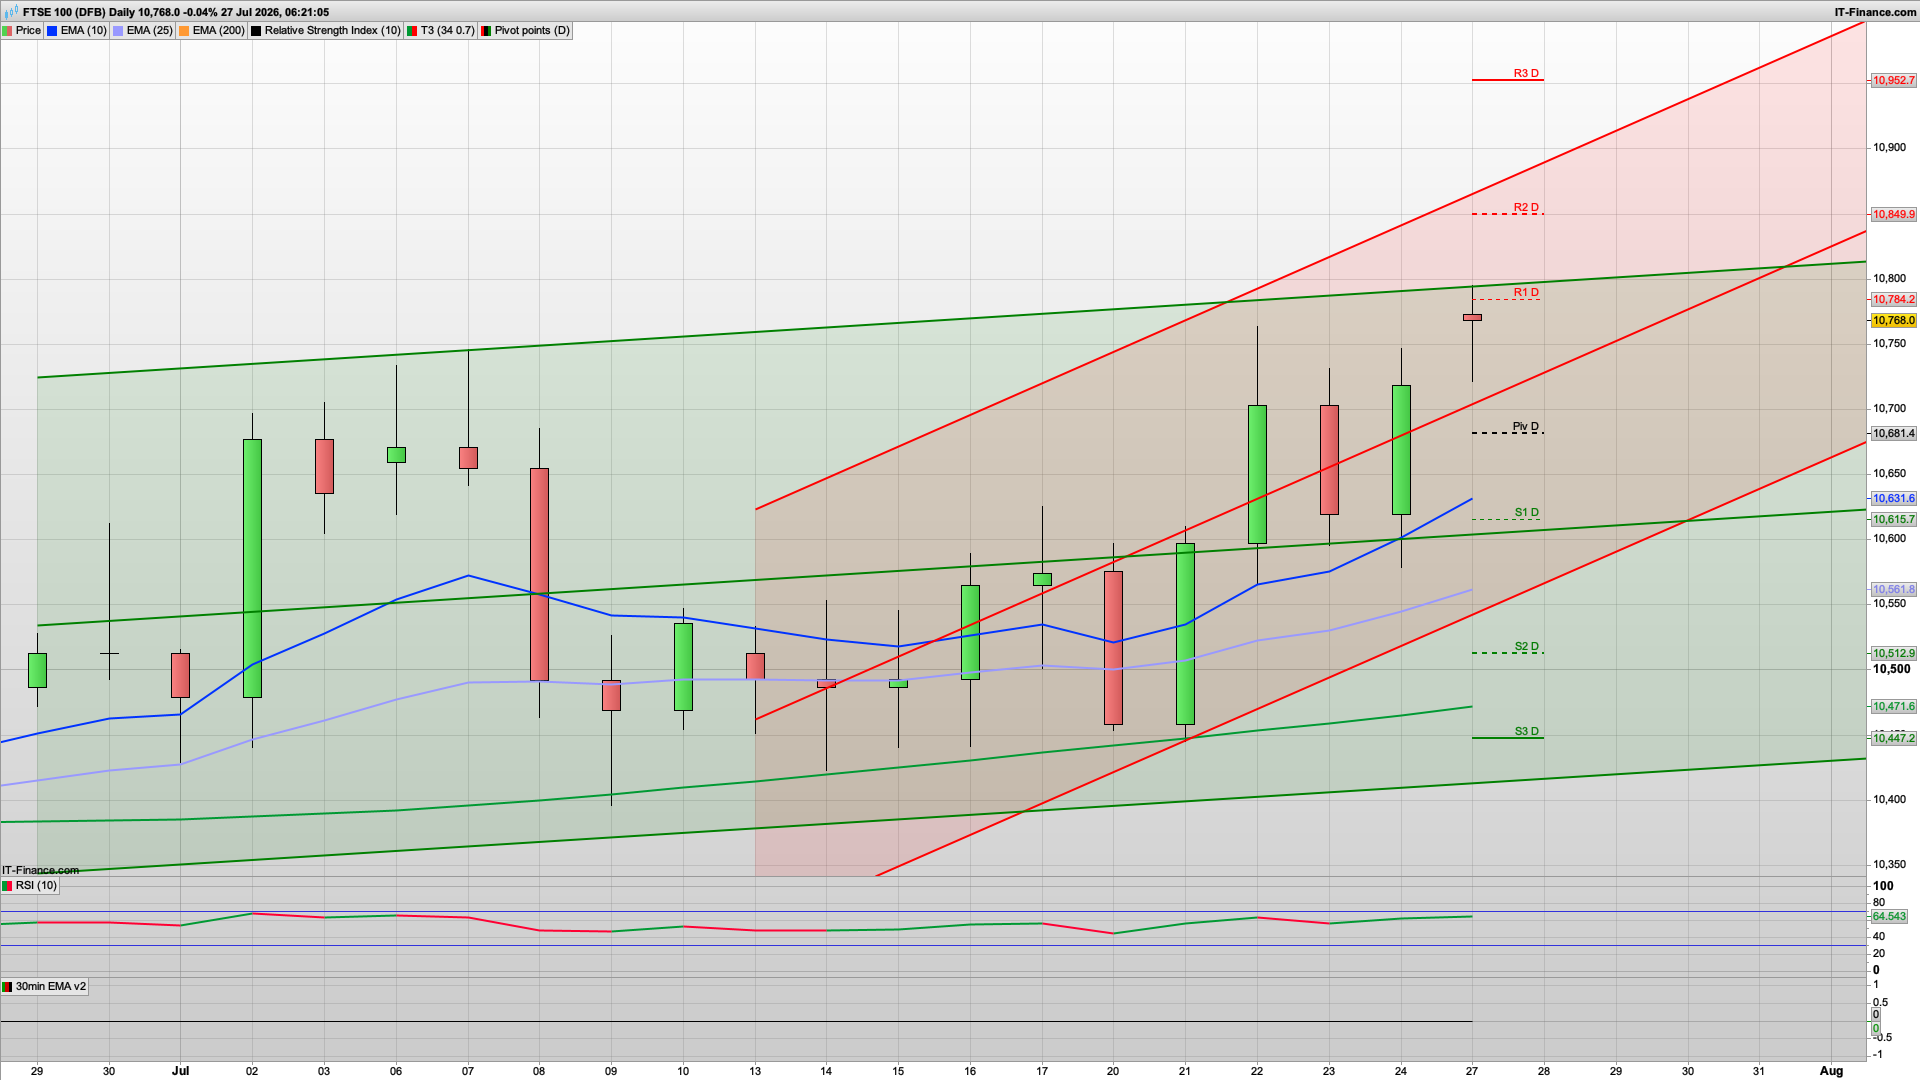
FTSE 100 - Bullish
- The FTSE remains the strongest equity index.
- Technical picture
- Strong sequence of higher highs.
- Trading comfortably above both moving averages.
- RSI holding in the mid-60s.
- Price continues respecting the rising channel.
- The preferred trade remains buying pullbacks rather than chasing breakouts.
DAX 40 - Bullish
- The DAX has produced a strong bullish breakout.
- Technical picture
- Strong green candle has broken above the previous resistance band.
- Trading above both the 10 EMA and 25 EMA.
- RSI has recovered to around 59.
- Price is now testing the R2 pivot level.
S&P 500 - Bullish
- The S&P remains the healthier US index.
- Technical picture
- Holding above the 25 EMA.
- Consolidating near the 10 EMA.
- Still inside the rising channel.
- SafeZone projection remains positive.
- While above the Pivot, dips should continue attracting buyers.
Nasdaq 100 - Bearish
- Although today's candle is positive, the broader structure is still weak.
- Technical picture
- Still below the falling 10 EMA.
- Trading beneath the descending trend channel.
- Price is only testing the R1 area rather than breaking higher.
- Lower highs remain intact.
- Treat today's move as a recovery unless buyers can reclaim the 10 EMA.
- Preferred strategy remains:
- Sell rallies into resistance.
- Avoid chasing strength until above 28,900.
Gold - Neutral / Bearish
- Gold remains in corrective mode.
- Technical picture
- Small indecision candle after Friday's decline.
- Still below the upper trend resistance.
- Trading around the Pivot.
- 10 EMA remains below the 25 EMA.
- Gold needs to reclaim 4,083–4,110 before a stronger bullish case develops. Until then, expect range trading or another test of support.
The standout theme today is the continued divergence between Europe and the US technology sector. The FTSE 100 and DAX 40 are showing improving momentum and remain the preferred long opportunities on pullbacks. The S&P 500 continues to trend higher but is less convincing than the European indices. The Nasdaq 100 is still lagging and remains vulnerable unless it can reclaim its short-term moving averages, while Gold is consolidating after last week's reversal and has yet to produce a fresh bullish signal.
Interested in how to start trading the FTSE 100? Frequently Asked Questions on Spread betting
Recommended Broker for trading - MT4/5, web and mobile

IC Markets - offers market leading pricing and trading conditions by providing clients with True ECN Connectivity; this allows you to trade on institutional grade liquidity from the world’s leading investment banks, hedge funds and dark pool liquidity execution venues. Highly recommended!
Join my Membership for Trading Tips, Support and Resistance Levels with Live Trading
If you would like more detailed analysis for FTSE 100, DAX40, Gold and the S&P500, including the trades that I am looking to take myself, then please join my active members community.
Keep up to date with new website posts, free sign up below