
Technical analysis for FTSE 100 for 10th September 2025
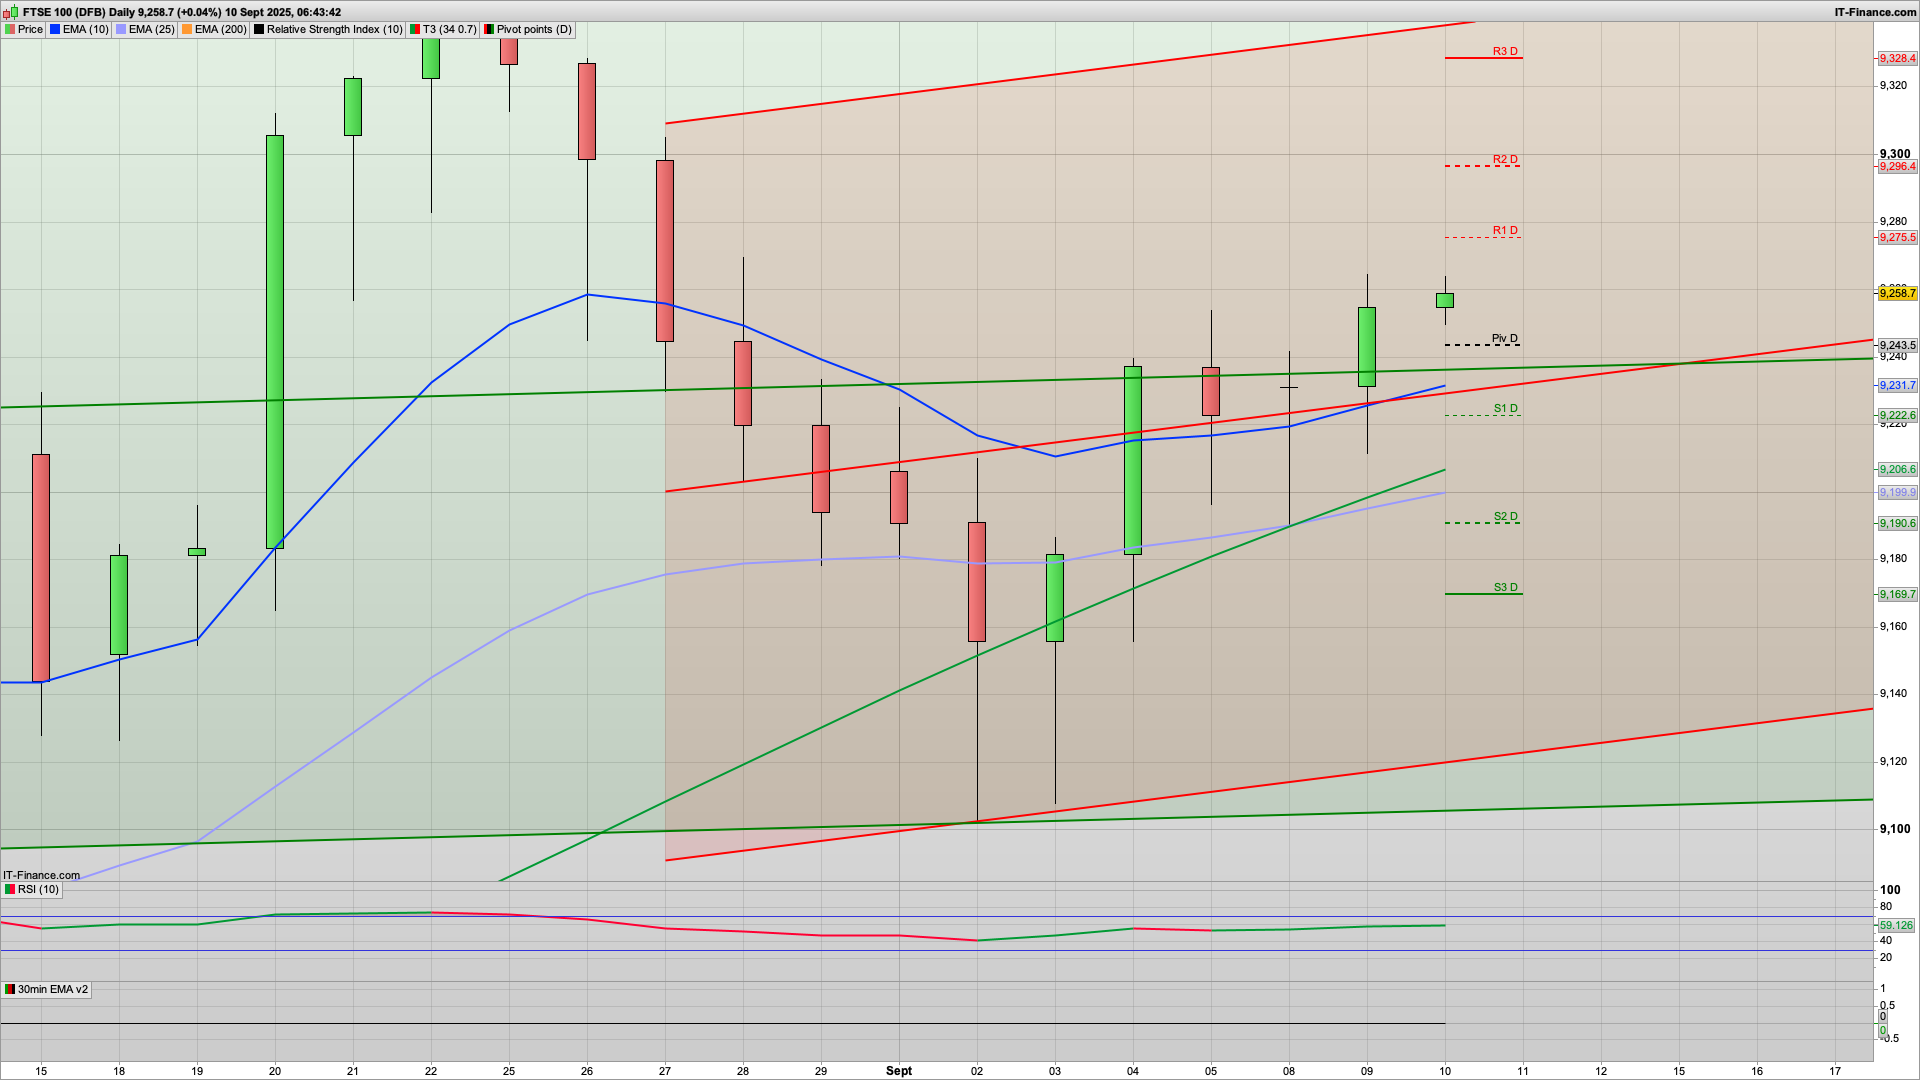
The FTSE100 remains poised for a rise to test the 9280 area having consolidated overnight. Key will be any test of the daily pivot at 9243 holding initially as that should then see a climb to that resistance. The 2h chart is bullish again, having seen the FTSE100 rise off the 9212 level yesterday (just missing 9210!) and has 9252 as Hull MA support initially. We have seen this hold overnight, and despite yet more political tensions in the Middle East, have only seen the price of oil rise so far (though may also explain gold's recent bullish run as certain parties were privy to the Qatar attack). Oil rising does of course help BP and Shell which are major components of the FTSE100.
If the bears break the 9243 pivot level then the next key support area is around 9225 where we have the next cluster of supports, including S1, 30m 200ema and the green 2h coral. As such this area may well see a reaction if seen as the bulls continue to build on the recent strength. A break of this though and then we will likely see a slide down to 9190 again, where we have the S2 level for today. I am more inclined to go with some strength today though, with the US markets continuing their bullish run for a bit longer.
Does still feel like buy the dip is the right play!
If the bulls were to break above the 9280 level then I expect we will see a test of the 9300 level and the key fib at 9305. The top of the 10d Raff is at 9338 for today - bang on the recent high - so should it get really optimistic then a bearish reaction here is likely. Might be a big ask for today though! I am more inclined to expect today to top out at the 9300 area as we have the R2 and fib here.
Both the daily Raff channels are rising again now as the bullish climb continues having bounced off the 9100 level at the start of the month.
For the DAX40 it's a similar picture with a potential drop down to the pivot at 23770 and we also have the 30m 200ema and corals here to lend weight to this level. As such I would like to see that hold for a rise to then test the R1 and key fib at the 23905-23915 area. If the bears defend this then expect a drop back to the daily pivot again. Higher up than R2 is 23998 and coincides with the round number so would likely see profit taking/shorting. Below the daily pivot then it may well slide as low as 23587 to test the key fib support. That said, the 2h chart is bullish with 23755 Hull MA support so I am more inclined to go with any drop to this area holding.
The S&P500 is also looking bullish, with 6512 support from the daily pivot and just below the Hull MA 2h support at 6520. Again, a dip to this area then a rise towards the 6560 R2 and 6557 key fit would be a good to see today. A break of the pivot then look for a slide towards 6500 and a test of S1, 2h coral and 30m 200ema.
Good luck today.
Interested in how to start trading the FTSE 100? Frequently Asked Questions on Spread betting
Recommended Broker for trading - MT4/5, web and mobile

IC Markets - offers market leading pricing and trading conditions by providing clients with True ECN Connectivity; this allows you to trade on institutional grade liquidity from the world’s leading investment banks, hedge funds and dark pool liquidity execution venues. Highly recommended!
Membership, Trading Tips, Support and Resistance Levels with Live Trading
If you would like more detailed analysis for FTSE 100, DAX40, Gold and the S&P500, including the trades that I am looking to take myself, then please join my active members community.
Keep up to date with new website posts, free sign up below
