
Technical analysis for 8th October 2026
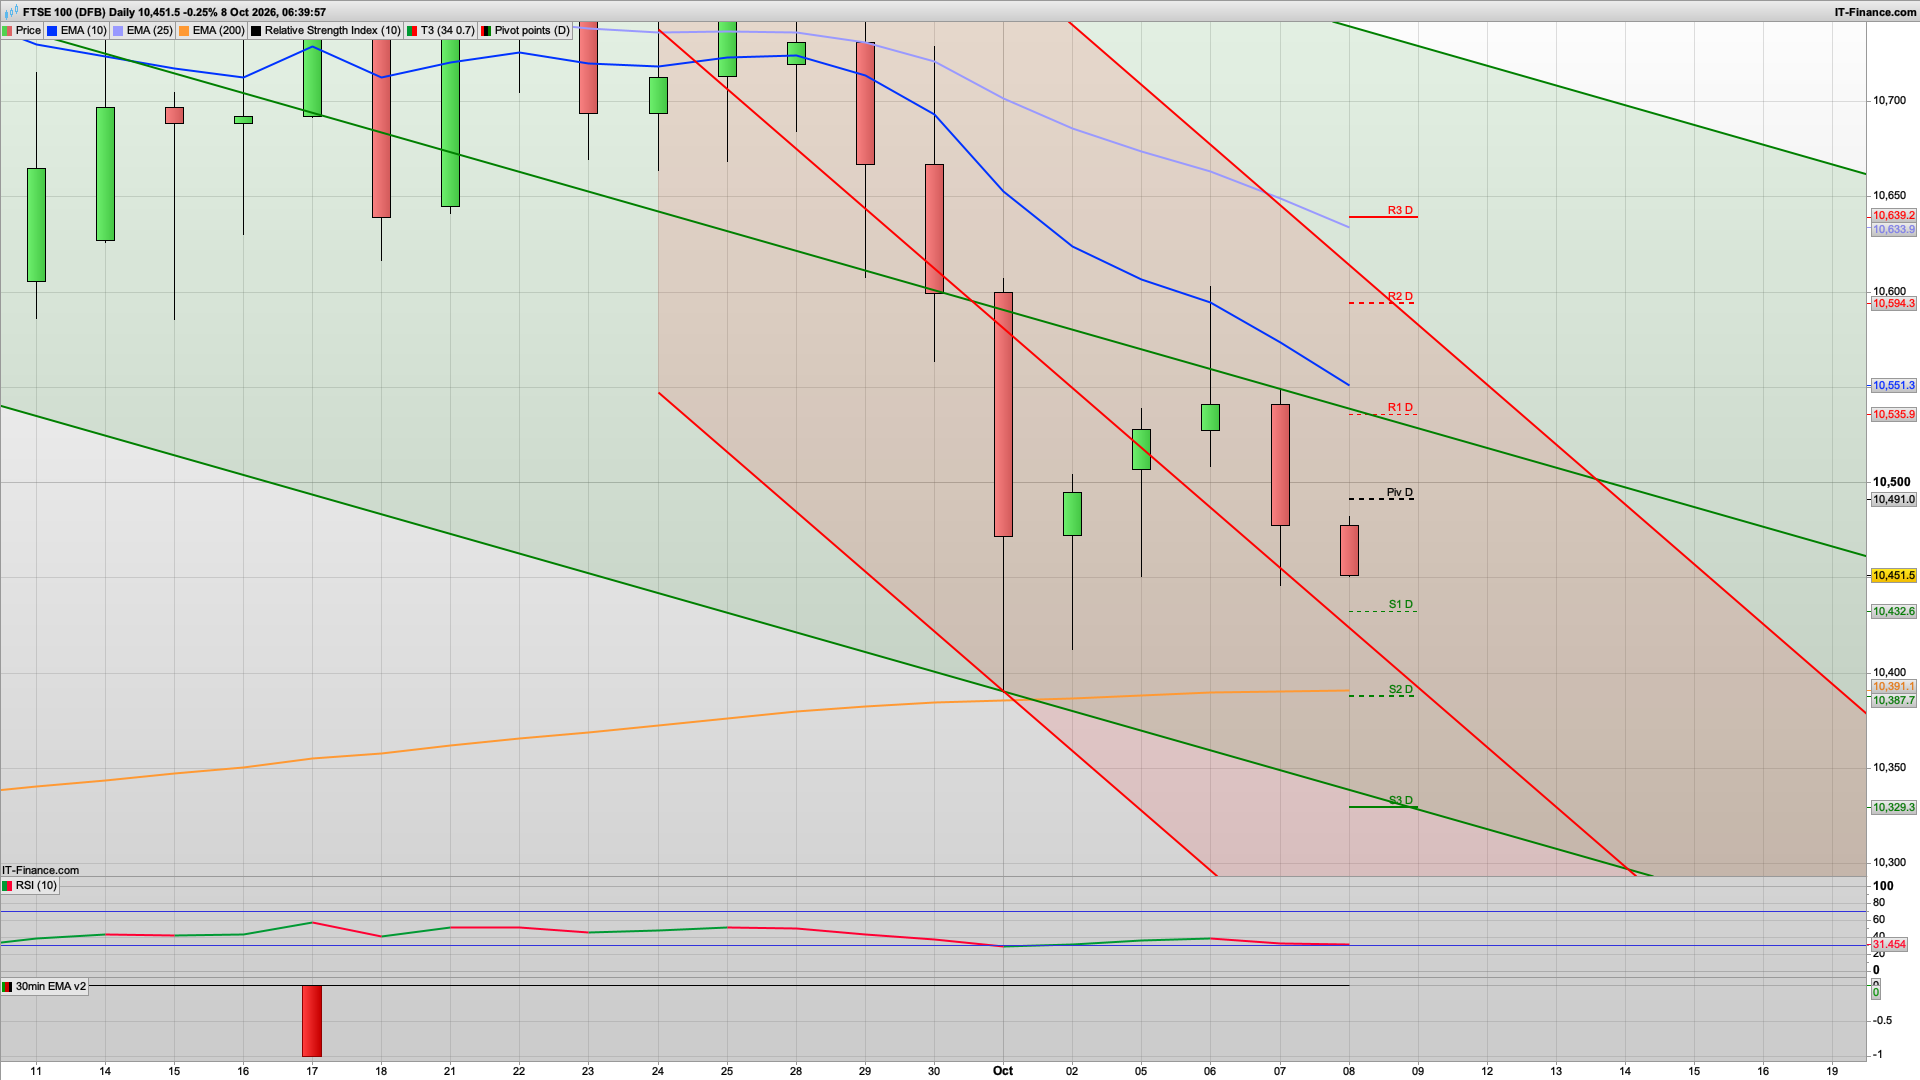
The FTSE has deteriorated again overnight. Yesterday's attempted recovery has failed, and the market is now trading around 10,451, below the daily pivot and beneath all the important short-term moving averages.
However, there's an important distinction today: the bearish trend is strong, but we're approaching another significant support level at 10,433.
My preferred strategy is to sell a recovery towards resistance, ideally after a clear 30-minute rejection.
- Yesterday's recovery towards 10,550 failed, leaving another lower high.
- The latest daily candle has moved back towards the lower part of the descending channel.
- Daily RSI has fallen to approximately 31.5, suggesting persistent selling pressure but increasing potential for a short-covering bounce.
The 30-minute chart is equally bearish. The overnight session has produced a steady decline, with the 10 and 25 EMAs above price and the 200 EMA considerably higher. The ideal scenario is for the FTSE to recover some of its overnight losses before sellers return. The 10,490–510 region is attractive because it includes today's daily pivot, the recent overnight breakdown area and nearby 30-minute moving-average resistance.
If the bears remain in control then we may well see another attempt to test the 10390 support level and with S2 here today I would like to see a bounce here if we see it today, otherwise we are on track for another 100 down towards the 10290 level. To lend support to the 10390 area we also have the daily 200ema here.
If the bulls can break above the daily pivot and 10491 then I am looking at R1 10530, and the key fib just above at 10556. This level would be worth a short as it's quite strong resistance in the short term, as a break of this would likely then enable a rise towards the 10670 level.
Initially today the backdrop is predominantly bearish though, with the 2h chart also having gone bearish, and Hull and coral resistance at 10485.
For more more analysis including other markets please join...
Interested in how to start trading the FTSE 100? Frequently Asked Questions on Spread betting
Recommended Broker for trading - MT4/5, web and mobile

IC - offers market leading pricing and trading conditions by providing clients with True ECN Connectivity; this allows you to trade on institutional grade liquidity from the world’s leading investment banks, hedge funds and dark pool liquidity execution venues. Highly recommended!
Join my Membership for Trading Tips, Support and Resistance Levels with Live Trading
If you would like more detailed analysis for FTSE 100, DAX40, Gold and the S&P500, including the trades that I am looking to take myself, then please join my active members community.
Keep up to date with new website posts, free sign up below