
Technical analysis for 10th March 2026
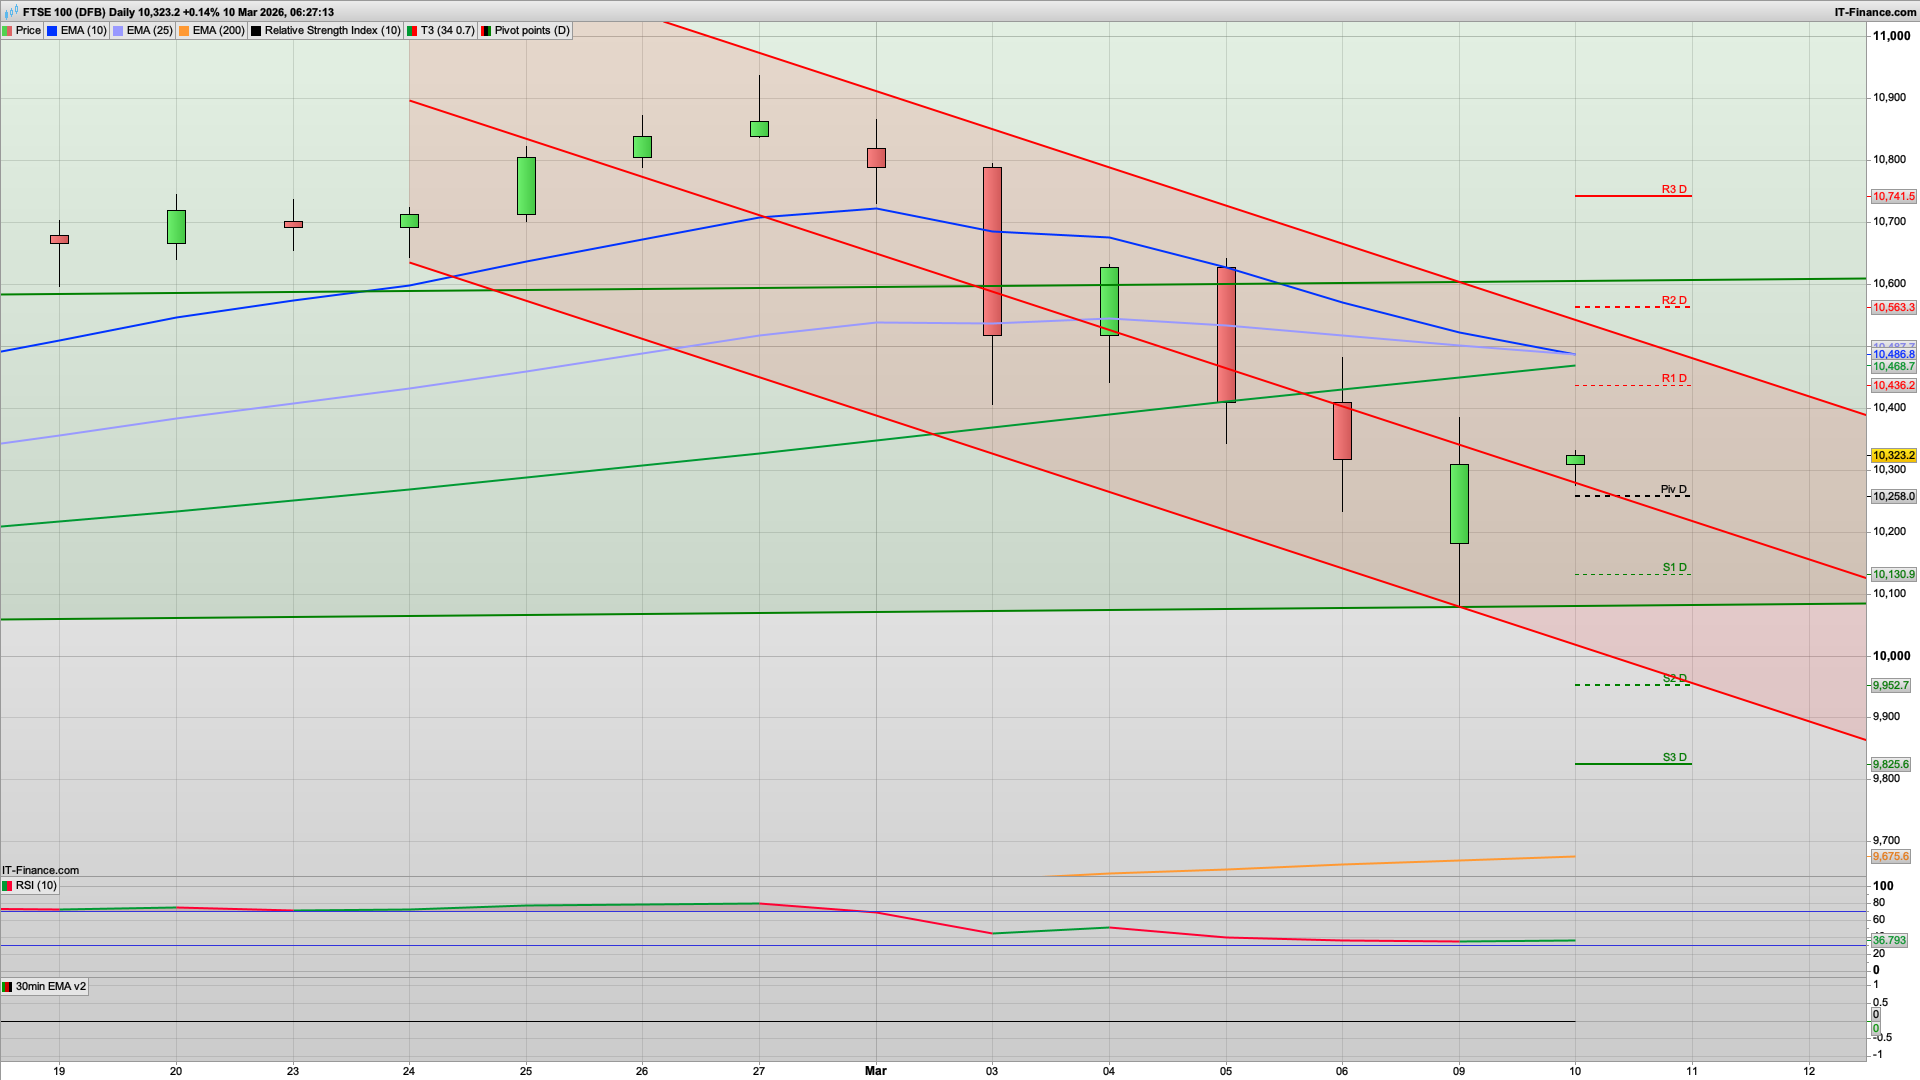
FTSE 100 — Bearish correction
- Structure
- Multiple strong bearish candles
- Price still inside a descending correction channel
- Trading below pivot and EMAs
- The small green candle is just stabilisation after the selloff.
- Bias: Sell rallies
DAX — Bearish trend continuation
- Structure
- Price still inside a clear descending channel
- EMAs sloping down
- Price holding below pivot
- Rejection from mid-channel earlier
- The small candle today shows indecision after the bounce, not a reversal.
- Bias: Sell rallies
- Upside likely capped near R1 / channel midline.
S&P 500 — Bearish but attempting a bounce
- Structure
- Strong bullish bounce from S2 / channel base
- Still below pivot and EMA cluster
- Trend channel still pointing down
- This looks like a relief bounce inside a downtrend.
- Bias: Sell strength
- First resistance = pivot → EMA zone.
GOLD — Bullish recovery
- Structure
- Uptrend channel still intact
- Price reclaiming pivot
- Higher lows forming again
- Momentum turning upward after correction.
- Bias: Buy pullbacks
That was quite the climb on the FTSE100 from the 10100 level and a drop on oil from $115 so the bulls will be looking to build on both of those moves. However I am thinking that we will see a dip and rise for the FTSE100 today, as a bear Tuesday kicks in to start with at least, and a drop down to the 10205 Hull MA support area would fit the charts well. At the end of the day the war isn't "over" and there is some good profits to be taken at the 10350-10390 area.
10386 is also the 30m 200ema, so we may well see any early rally fizzle out here and a drop down to the daily pivot at 10258, and then possibly that Hull MA at 10205. Generally the bias as you can see above is still to sell the rallies so a dip and rise would make sense.
If the bulls were to break above the 10390 level then I am looking at R1 area at 10436 as the next zone to try shorting. If we do dip back and test the various Hull MA supports on the FTSE100, S&P500 and DAX40 at 10204, 6745 and 23291 respectively then longs at these are worth a go.
Below 10200 then the bears will be aiming for the 10100 level again, and the bottom of the 20d Raff is also here, so should hold the first test. The 10d Raff is now heading downwards as you'd expect, with 10015 as support - I don't think we will get that low today though!
FTSE100 Summary
- Early push toward 10,380-10,430
- Rejection near resistance
- Market likely rotates back toward 10,250-10,200
- Unless R1 breaks strongly
Good luck today.
Interested in how to start trading the FTSE 100? Frequently Asked Questions on Spread betting
Recommended Broker for trading - MT4/5, web and mobile

IC Markets - offers market leading pricing and trading conditions by providing clients with True ECN Connectivity; this allows you to trade on institutional grade liquidity from the world’s leading investment banks, hedge funds and dark pool liquidity execution venues. Highly recommended!
Join my Membership for Trading Tips, Support and Resistance Levels with Live Trading
If you would like more detailed analysis for FTSE 100, DAX40, Gold and the S&P500, including the trades that I am looking to take myself, then please join my active members community.
Keep up to date with new website posts, free sign up below
