
Technical analysis for 9th March 2026
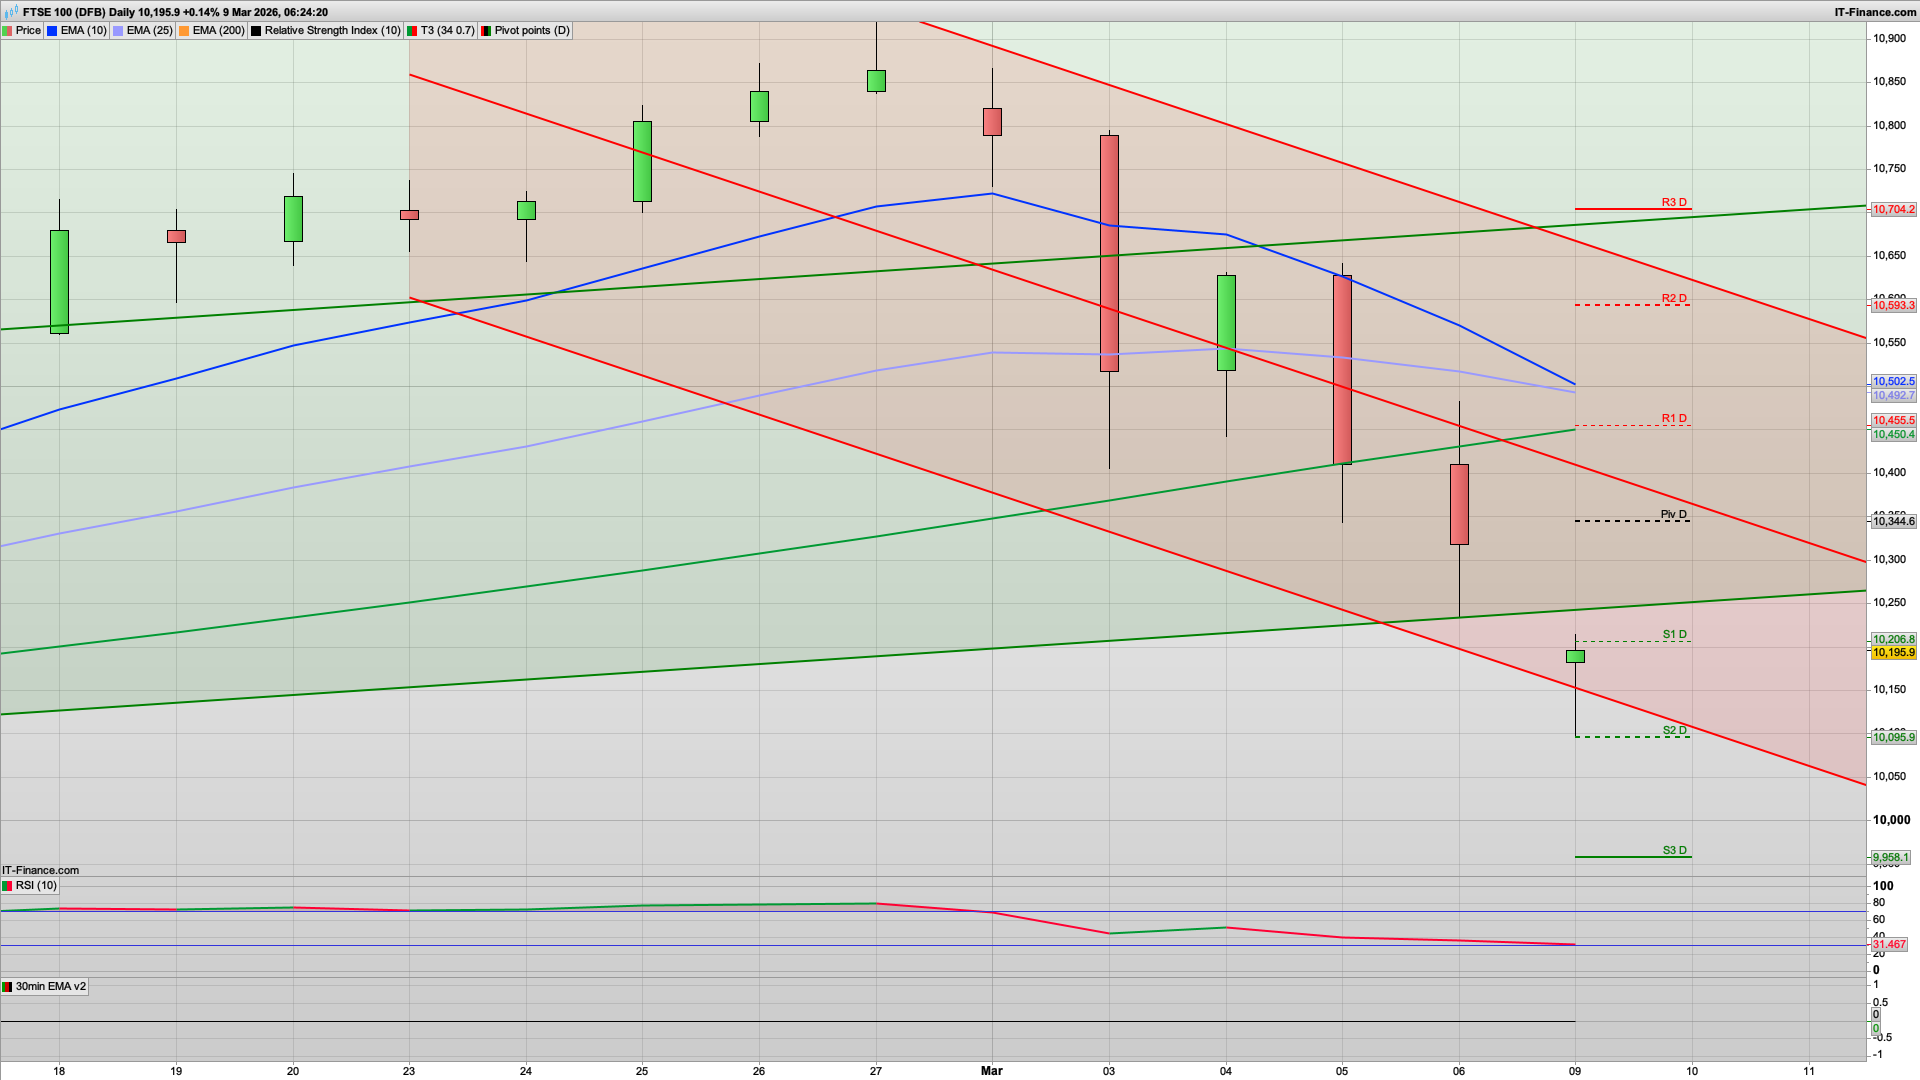
FTSE 100 — Bearish continuation
- Structure
- Clear breakdown from the prior uptrend
- Multiple impulsive bearish candles
- Trading near S1/S2
- EMAs rolling down
- Momentum remains negative.
- Bias: Sell rallies
DAX — Strong bearish continuation
- Structure
- Price broke below S1 → S2
- Trading at the lower edge of the descending channel
- EMAs sloping down strongly
- Multiple large bearish impulse candles
- The trend is accelerating lower.
- Bias: Sell rallies
- Only a reclaim of pivot + channel midline would neutralize the trend.
S&P 500 — Bearish but bouncing
- Structure
- Yesterday’s candle bounced from S2
- Still inside the descending channel
- Price still below pivot and EMAs
- This looks like a technical bounce inside a downtrend.
- Bias: Sell strength
- Likely resistance near pivot / EMA cluster.
GOLD — Bullish recovery
- Structure
- Strong bounce from trend support
- Reclaimed pivot
- Still inside the broader uptrend channel
- Momentum is turning positive again.
- Bias: Buy pullbacks
Summary plan for the FTSE100
- Early bounce toward 10,300-10,350
- Afternoon rejection
- Market holds 10,100-10,200 range
- Unless pivot breaks strongly
Well we have gapped down to start the week but the 10100 has held overnight and seen a 100 point bounce before most people are even up. With oil unsurprisingly racing upwards that will be helping BP and Shell, though not Joe Public! For today I am thinking that the bulls will attempt to build on that initial rise and try for a gap close with Friday's closing price at the 10317 level. That would also be another test of the 2h Hull MA, currently at 10305 so a drop back off this area would fit the charts well.
That pattern may well play out on the S&P500 as they won't like a big gap down for a Monday and will be looking to gap close on that as well, at the 6735 area. Basically a rise and dip day as we at least attempt a bull Monday to start with.
If the bulls were to break above the 10310 area then a pivot test at 10344 is next up, and if they were to break this it will certainly reduce the bearish bias and a rise towards the 25ema on the daily at 10490 may well play out. Seems optimistic but you never know.
Support wise then the overnight low and S2 should hold on an in hours test, at 10095. We are also just creeping below the daily Raff channels this morning so the bulls would be keen to regain control back within them - the 10day is currently at 10150 so the bulls will be looking at least to close above that today. Below 10095 though we may well see 10000, and possibly S3 at 9958 - but the bulls will be keen to defend the 10000 level if it gets that bearish.
There isn't any major UK centric economic news out today as it will be a case of watching developments in the Middle East still.
Good luck today.
Interested in how to start trading the FTSE 100? Frequently Asked Questions on Spread betting
Recommended Broker for trading - MT4/5, web and mobile

IC Markets - offers market leading pricing and trading conditions by providing clients with True ECN Connectivity; this allows you to trade on institutional grade liquidity from the world’s leading investment banks, hedge funds and dark pool liquidity execution venues. Highly recommended!
Join my Membership for Trading Tips, Support and Resistance Levels with Live Trading
If you would like more detailed analysis for FTSE 100, DAX40, Gold and the S&P500, including the trades that I am looking to take myself, then please join my active members community.
Keep up to date with new website posts, free sign up below
