
Technical analysis for 5th June 2026
Today's charts show a clearer divergence developing:
- FTSE100: weakest major index, still trapped in a descending channel.
- DAX40: still weak, trading below pivot and below the falling channel resistance.
- Nasdaq: bullish trend intact, holding above rising 25 EMA.
- S&P 500: bullish recovery after yesterday's pullback.
- Gold: bearish trend remains dominant.
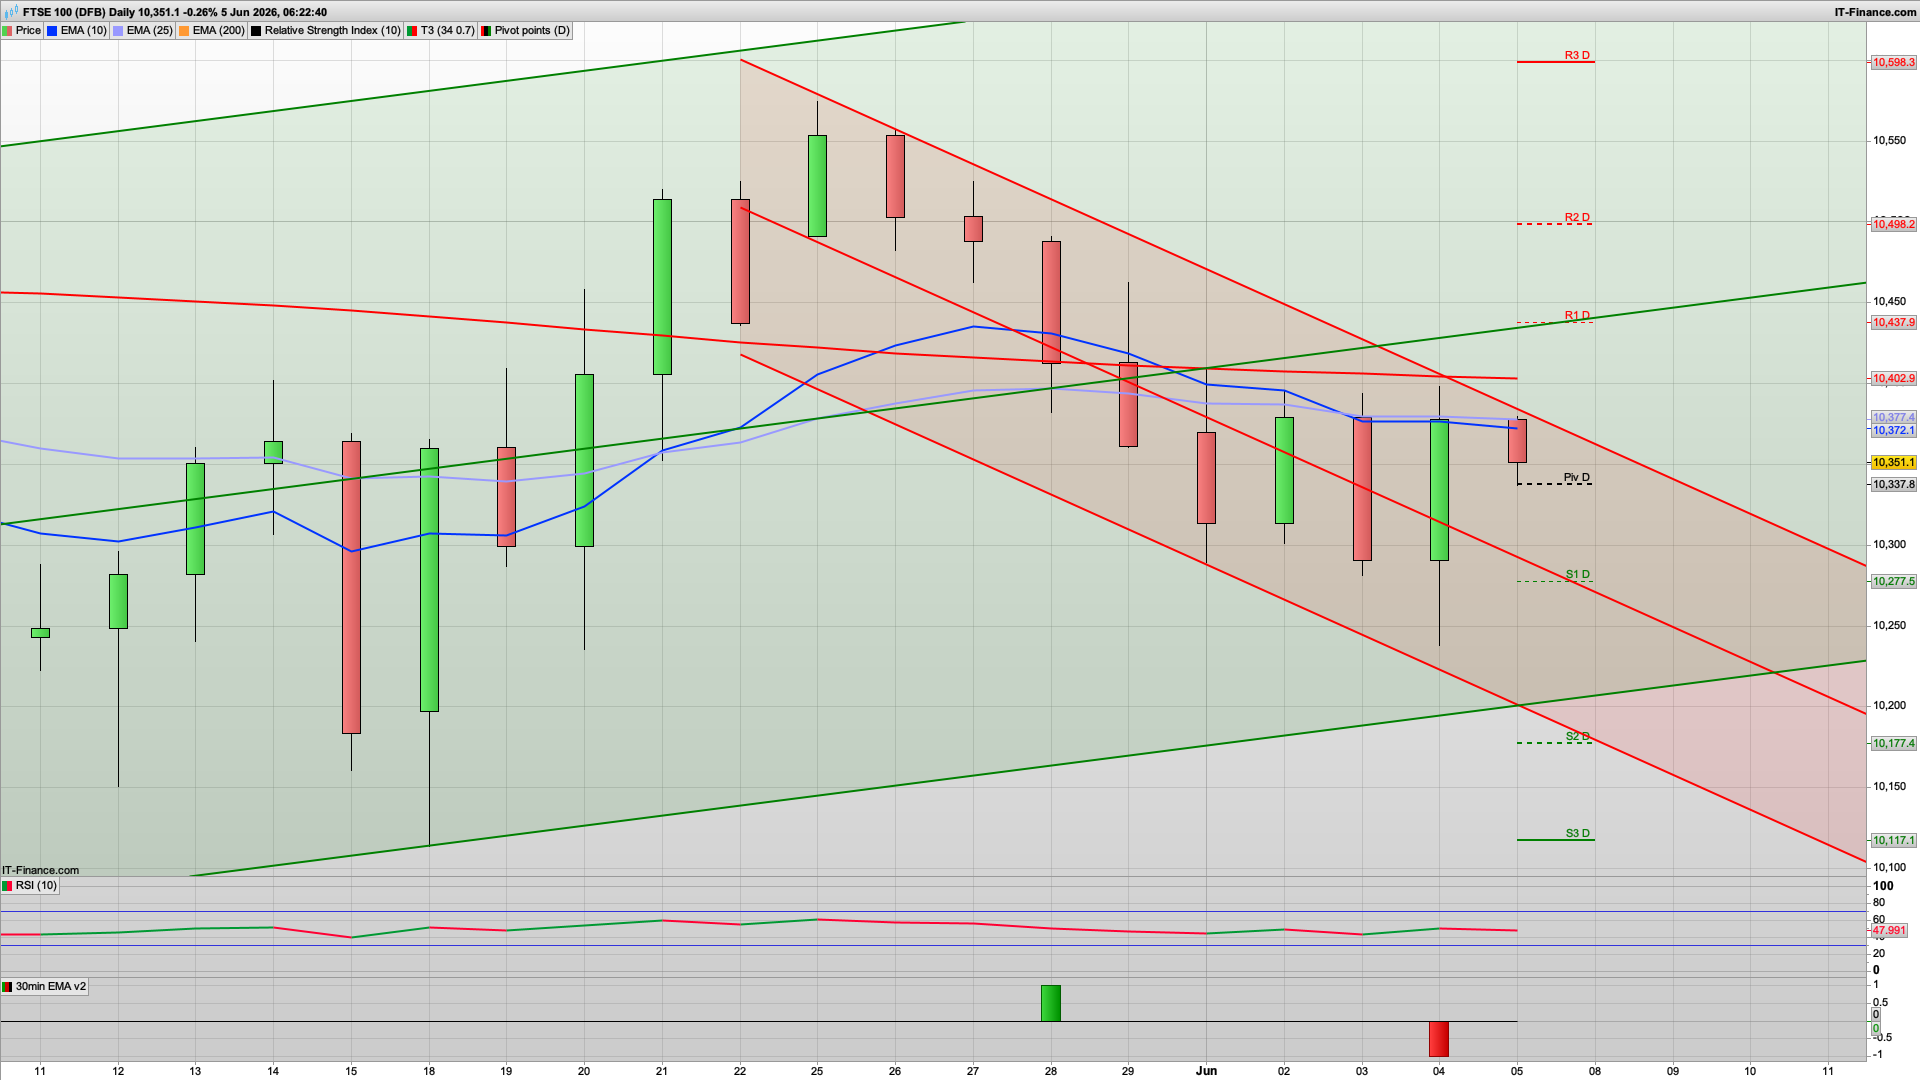
FTSE 100
- Bias: Bearish
- Still trading inside a descending channel.
- Below both moving averages.
- Failed recovery attempts.
- Relative weakness versus US markets continues.
- Key Levels
- Resistance: 10,377 → 10,402 → 10,438
- Support: 10,277 → 10,177
- Trade Idea
- Sell rallies into resistance.
- Only a break above 10,400 would change the outlook.
- Targets: 10,277 then 10,177
DAX 40
- Bias: Bearish
- Lower highs continue.
- Price remains below pivot (24,851).
- 25 EMA rolling over.
- Yesterday's bounce failed to reclaim resistance.
- Key Levels
- Resistance: 24,851 → 25,045
- Support: 24,695 → 24,501 → 24,344
- Trade Idea
- Sell rallies below 24,850.
- Bears remain in control while below pivot.
- Targets: 24,695 then 24,500
Nasdaq 100
- Bias: Bullish
- Strong uptrend channel intact.
- Price holding above EMA25 and trend support.
- Yesterday's small green candle suggests buyers defended support.
- Structure remains higher highs and higher lows.
- Key Levels
- Resistance: 30,433 → 30,760 → 30,979
- Support: 30,108 → 29,888
- Trade Idea
- Buy pullbacks toward 30,100–30,150.
- Momentum remains positive above 30,100.
- Targets: 30,433 then 30,760
S&P 500
- Bias: Bullish
- Sharp rejection lower on 3 June has been bought.
- Trading back above EMA25.
- Pivot sitting at 7,552.
- Structure remains constructive.
- Key Levels
- Resistance: 7,592 → 7,638 → 7,677
- Support: 7,506 → 7,467
- Trade Idea
- Above pivot, favour longs.
- Dips into 7,520–7,530 likely attract buyers.
- Targets: 7,592 then 7,638
Gold
- Bias: Bearish
- Downtrend channel remains intact.
- Price below both EMAs.
- Lower highs and lower lows continue.
- Yesterday's green candle looks corrective rather than trend-changing.
- Key Levels
- Resistance: 4,489 → 4,548 → 4,581
- Support: 4,437 → 4,404 → 4,365
- Trade Idea
- Sell rallies toward 4,490–4,500.
- Trend remains bearish while below 4,550.
- Targets: 4,437 then 4,404
Strongest Setups Today
- Nasdaq Long
- Best trend structure.
- Buy dips above 30,100.
- S&P 500 Long
- Bullish recovery underway.
- Buy above pivot.
- DAX Short
- Below pivot and under channel resistance.
- FTSE Short
- Persistent relative weakness.
- Gold Short
- Bearish trend intact but prone to sharp squeezes.
Overall Market Theme
- US indices = bullish bias.
- European indices = bearish bias.
- Gold = bearish bias.
The cleanest directional expression today remains long Nasdaq / short FTSE or DAX, which continues to be the strongest relative-strength trade visible on the daily charts.
A decent bounce from the 10250 level yesterday that may well see the bulls continue today but we do have NFP in the mix to be the main driver. That said, initial resistance is at 10380 this morning so we could see some further shorting here initially on any kick up from the daily pivot level at the 10350 early doors.
That was also yesterday's high so is a key line in the sand. If the bulls were able to break that (and we may well need US support again for the FTSE100 bulls) then I am looking at a rise to test the 10437 R1 level today. We may well see some optimism ahead of the weekend as well. Prior to that then look for a possible reaction at the key fib at 10417.
With the rise yesterday the 2h chart has once again gone bullish and we have Hull MA support at the 10310 level. Below this then S1 and the key fib are both at the 10275 level and if we were to see a test of this then I like the look of a long here for another decent bounce. Slightly higher low than yesterday if it did so which bodes well for overall continued upside as June progresses.
The bulls will also be keen to break above the daily 25ema at 10377 today and try and get the daily chart bullish again - we also have the top of the 10d Raff here (hence thinking an initial dip from here this morning fits well). They will also be looking to defend any test of the daily pivot at the 10337 to start with and as mentioned a break of that will likely mean a move to 10275.
Good luck today and have a great weekend.
Interested in how to start trading the FTSE 100? Frequently Asked Questions on Spread betting
Recommended Broker for trading - MT4/5, web and mobile

IC Markets - offers market leading pricing and trading conditions by providing clients with True ECN Connectivity; this allows you to trade on institutional grade liquidity from the world’s leading investment banks, hedge funds and dark pool liquidity execution venues. Highly recommended!
Join my Membership for Trading Tips, Support and Resistance Levels with Live Trading
If you would like more detailed analysis for FTSE 100, DAX40, Gold and the S&P500, including the trades that I am looking to take myself, then please join my active members community.
Keep up to date with new website posts, free sign up below
