
Technical analysis for 9th June 2026
Asian stock markets eked out a rally on Tuesday and oil prices came off highs after Israel and Iran said they would halt attacks on each other for now, while ever-hopeful investors bought the latest dip in semiconductor stocks.
The overall picture has shifted slightly compared with last week:
- US indices are attempting a recovery but remain below key channel resistance.
- FTSE is improving and looks more constructive than the DAX.
- DAX remains the weakest equity index.
- Gold remains in a downtrend despite the bounce.
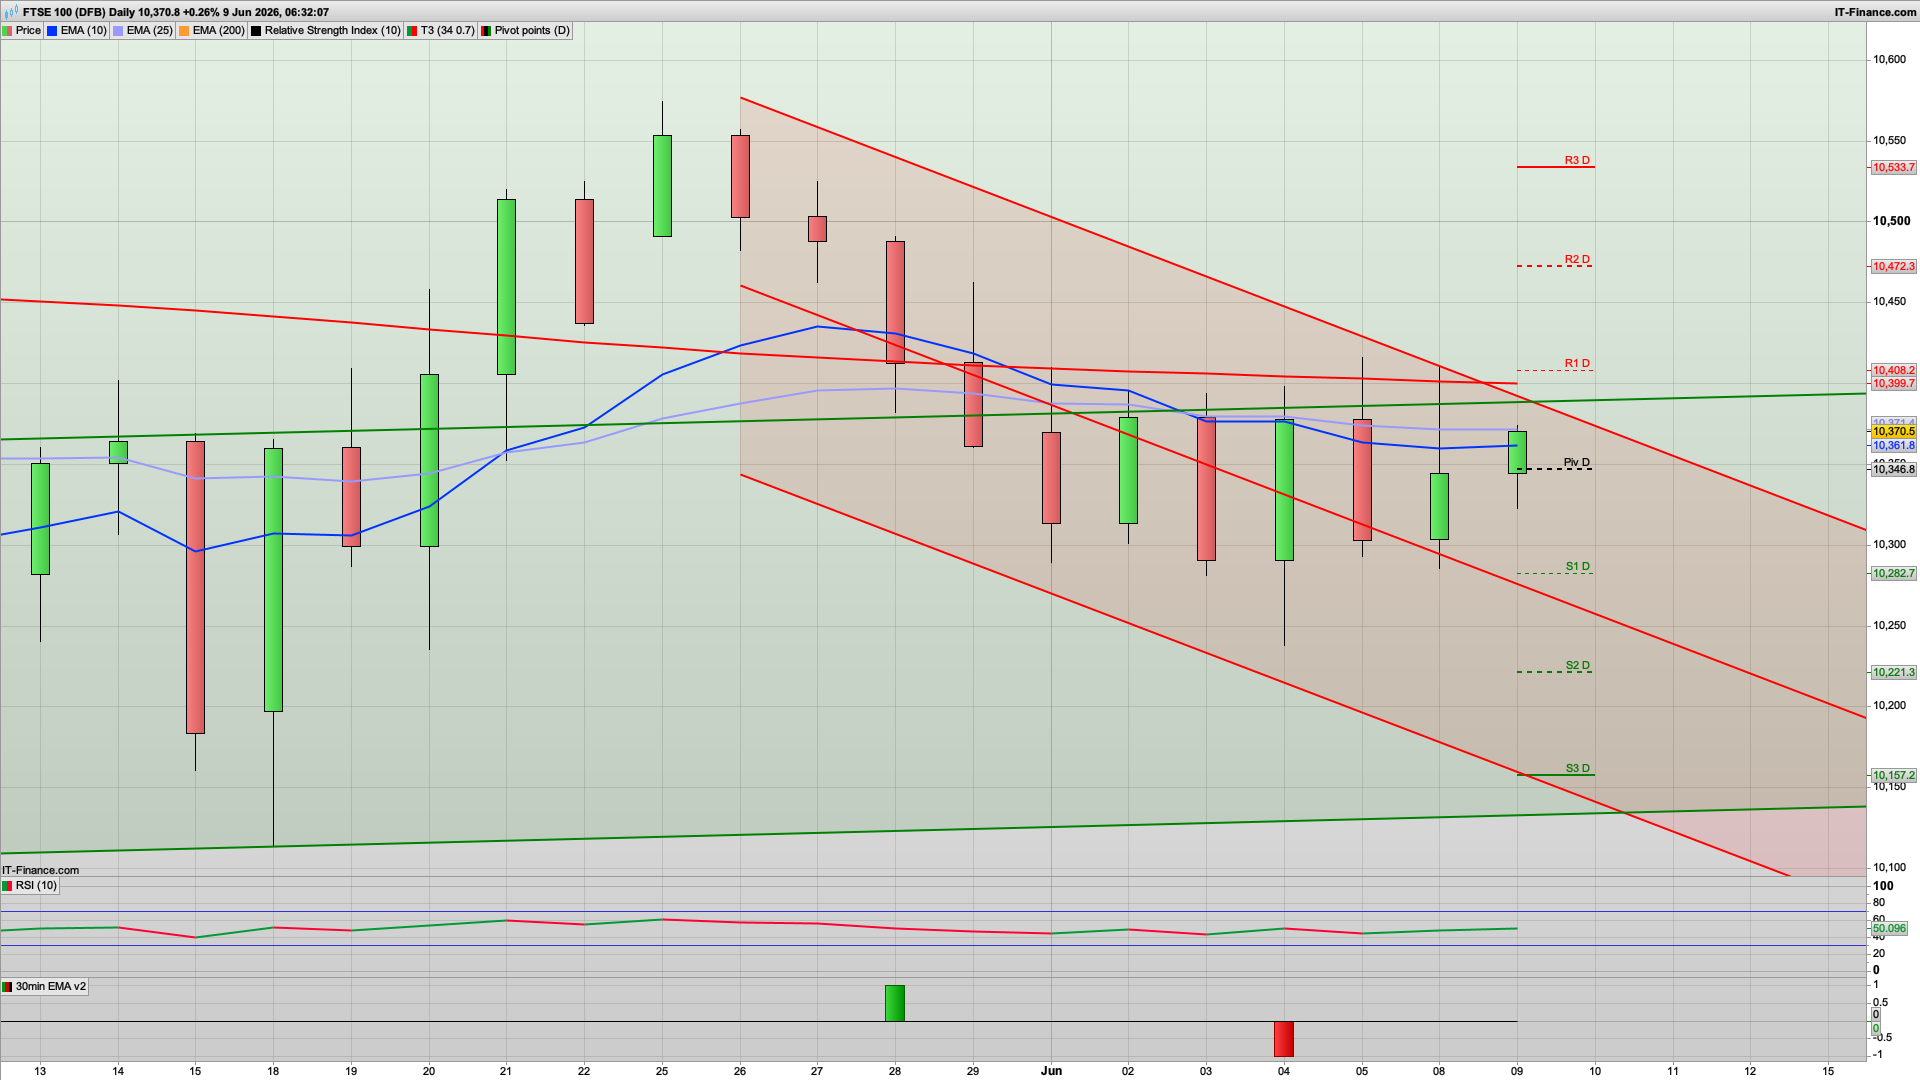
FTSE 100
- Bias: Neutral to Bullish
- Still inside the descending channel.
- Price has reclaimed EMA25.
- Trading above pivot.
- Relative strength improving versus DAX.
- Key Levels
- Resistance: 10,400 → 10,408 → 10,472
- Support: 10,346 → 10,282
- Trading Plan
- Prefer buying dips while above 10,340.
- Break above 10,400 would be a meaningful bullish signal.
- Target: 10,400 then 10,472
DAX 40
- Bias: Bearish to Neutral
- Price remains below the falling channel midpoint.
- Trading below EMA25 (24,751).
- Below R1 (24,769).
- Recent candles show only a weak rebound after the sharp selloff.
- Key Levels
- Resistance: 24,751 → 24,769 → 24,963
- Support: 24,355 → 24,236 → 24,135
- Trading Plan
- Below 24,750 I favour selling rallies.
- Bulls need a daily close above 24,770 to trigger a larger squeeze.
- Target: 24,355 then 24,236
Nasdaq 100
- Bias: Bullish Recovery
- Strong recovery candle after the large selloff.
- Holding above EMA25.
- Price sitting just above the pivot.
- Trend structure remains broadly bullish despite the pullback.
- Key Levels
- Resistance: 29,849 → 30,160 → 30,620
- Support: 29,389 → 29,078
- Trading Plan
- Buy dips while above 29,400.
- A break above 29,850 would likely accelerate toward 30,160.
- Target: 29,850 then 30,160
S&P 500
- Bias: Bullish Recovery
- Holding above EMA25.
- Strong rejection from lower channel support.
- Buyers defended 7,350 area aggressively.
- Trading above pivot.
- Key Levels
- Resistance: 7,465 → 7,510 → 7,555
- Support: 7,419 → 7,375
- Trading Plan
- Long above 7,420.
- Stronger confirmation above 7,465.
- Target: 7,510 then 7,555
Gold
- Bias: Bearish
- Downtrend channel remains intact.
- EMA25 and EMA200 both above price.
- Current move is only a bounce into resistance.
- Structure remains lower highs and lower lows.
- Key Levels
- Resistance: 4,365 → 4,402 → 4,449
- Support: 4,280 → 4,232 → 4,195
- Trading Plan
- Sell rallies toward 4,365–4,400.
- Trend remains bearish until a break above 4,450.
- Target: 4,280 then 4,232
Overall Market Theme
- Bullish: Nasdaq, S&P, FTSE (slightly)
- Bearish: DAX, Gold
For today's session, the highest-probability directional trades from these daily charts are:
- Long Nasdaq
- Long S&P 500
- Short Gold
- Short DAX on rallies
The relative-strength trade remains Long Nasdaq / Short DAX, which is still the cleanest index spread visible on the daily timeframe.
Interested in how to start trading the FTSE 100? Frequently Asked Questions on Spread betting
Recommended Broker for trading - MT4/5, web and mobile

IC Markets - offers market leading pricing and trading conditions by providing clients with True ECN Connectivity; this allows you to trade on institutional grade liquidity from the world’s leading investment banks, hedge funds and dark pool liquidity execution venues. Highly recommended!
Join my Membership for Trading Tips, Support and Resistance Levels with Live Trading
If you would like more detailed analysis for FTSE 100, DAX40, Gold and the S&P500, including the trades that I am looking to take myself, then please join my active members community.
Keep up to date with new website posts, free sign up below
