
Technical analysis for 29th April 2026
FTSE 100
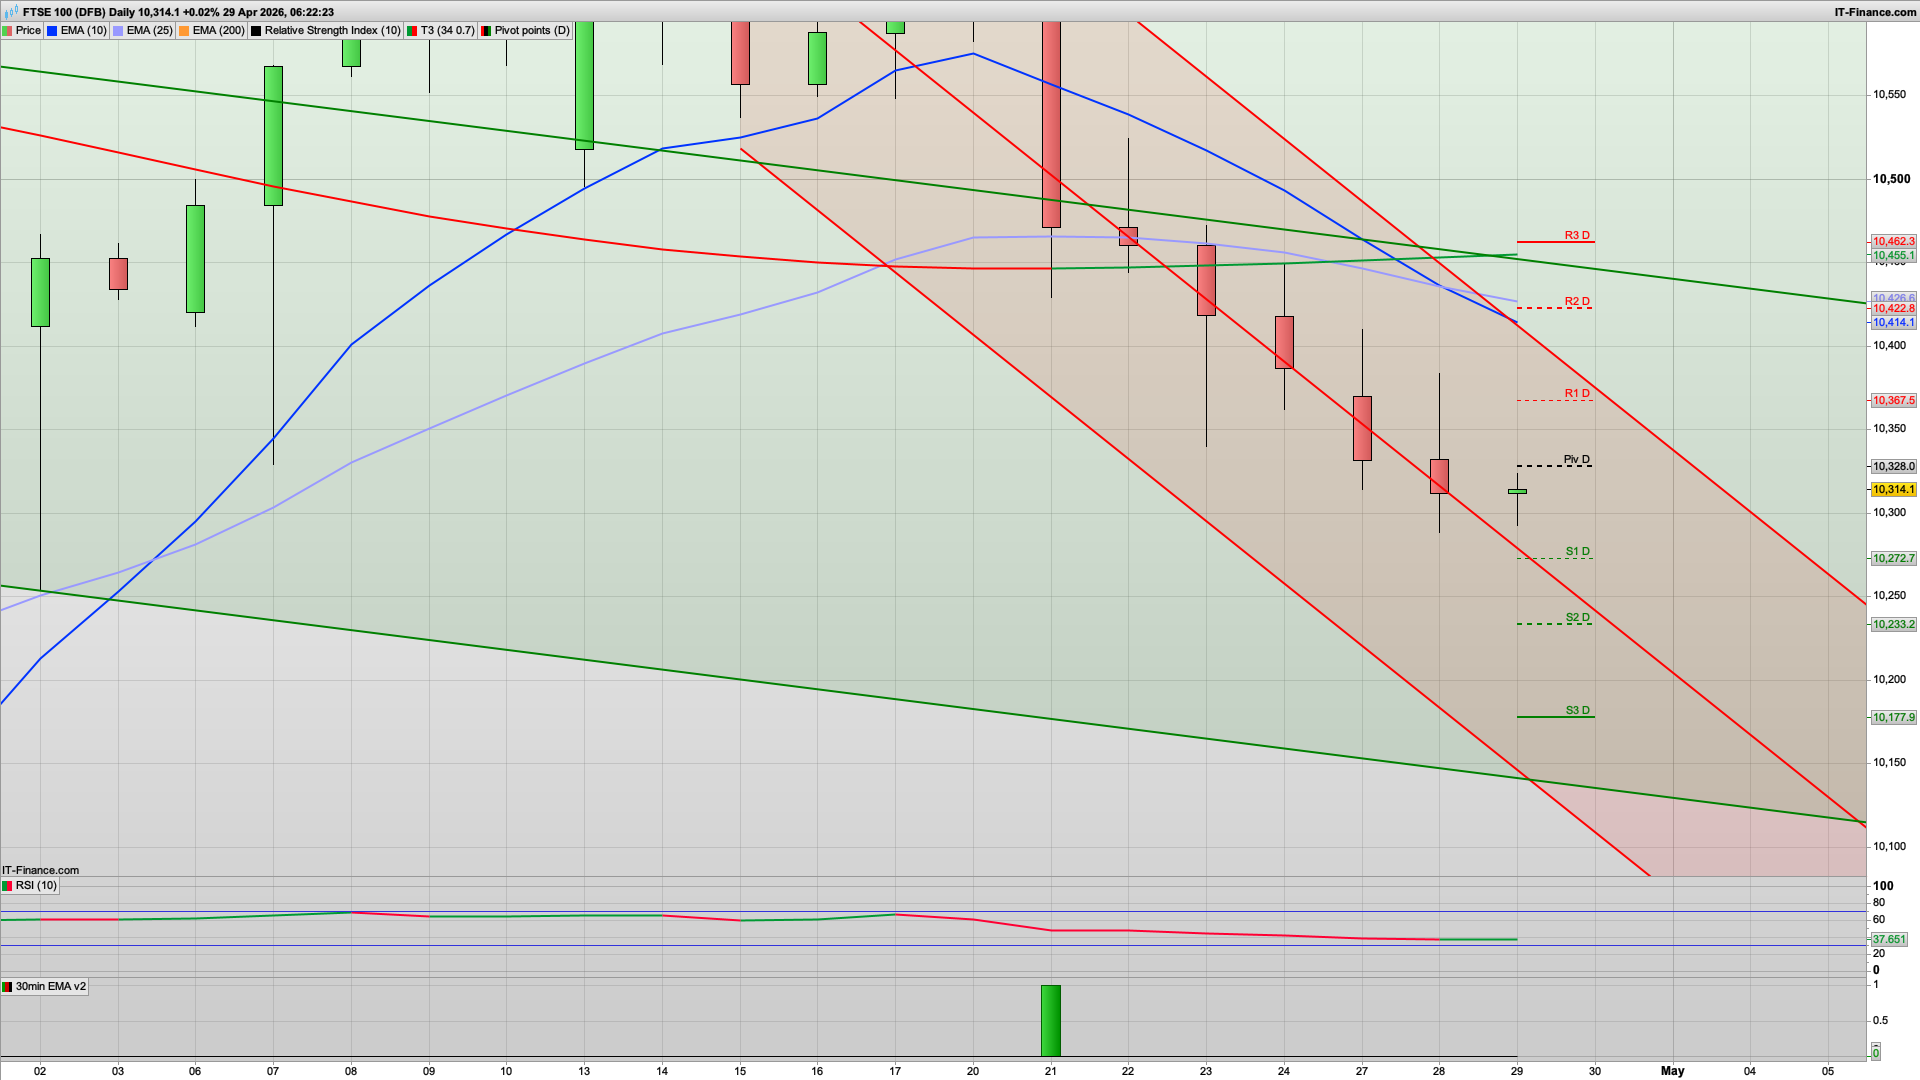
- Bias: Strong Bearish
- Clean downtrend channel intact
- Multiple consecutive red candles
- Below all key averages + pivot (~10,330)
- Plan
- Sell rallies:
- 10,350–10,450
- Targets:
- 10,250 → 10,180
- Sell rallies:
- Still best short market
DAX (Germany 40)
- Bias: Bearish (range breakdown risk)
- Sitting under pivot (~24,060)
- Lower highs + loss of momentum
- Still inside rising channel but weakening
- Plan
- Sell rallies:
- 24,150–24,250
- Targets:
- 23,950 → 23,850
- Sell rallies:
- Key: below pivot = pressure remains downside
NASDAQ (US Tech 100)
- Bias: Neutral → Bullish on dip
- Trend still up overall
- But:
- Rejection from highs
- Inside channel mid-range
- Trend still up overall
- Plan
- Buy dips:
- 26,900–27,000
- Sell only if:
- Clear break below channel
- Buy dips:
- Not clean today — wait for pullback entries
S&P 500 (US 500)
- Bias: Neutral / Slight Bearish
- Losing momentum after push higher
- Sitting around pivot (~7,150)
- No strong continuation
- Plan
- Range trade:
- Sell 7,200–7,250
- Buy 7,080–7,120
- Range trade:
- No strong edge — chop conditions
GOLD (XAUUSD)
- Bias: Bearish (continuation)
- Strong downtrend channel
- Lower highs + lower lows intact
- Weak bounce attempt
- Plan
- Sell rallies:
- 4,680–4,720
- Targets:
- 4,580 → 4,500
- Sell rallies:
- Trend still firmly down
The 10300 is proving a tough nut to crack for the bears and as such we may once again see any dip below that defended today, given its FED day and the rate decision is at 7pm this evening - buy the rumour sell the news therefore. This may well be Powell's last press conference too....
Initially we have resistance at the daily pivot at the 10328 level so a dip off this initially down to the S1 level at 10272 may well play out. The 2h chart is once again bullish and has Hull MA support at the 10290 level and this line has held well overnight as well. On the bearish side of things the daily chart has weakened a lot, with both the Raff channels heading down now, and the EMA cross over locking in 10425 as the EMA resistance. A rally to this area in the next few sessions therefore may well see a stall on this moving average.
If the bears were to break below the S1 level then 10254 is the key fib, with the next daily support at 10196 and a likely bounce off this.
Bullish wise, then a break above the daily pivot looks like it should manage the 10375 area and a test of R1 and the 30m 200ema, with the key fib just above at 10392. If we do see this area then a drop off from here would make sense.
Above the 10400 level then 10425 as mentioned above, with the daily level of 10524 higher still. Not expecting that today though!
We may well see dips defended on the FTSE100, DAX40 and S&P500 today and I am looking at the key support on the 24025 and 7140 for those as well.
Good luck today.
Interested in how to start trading the FTSE 100? Frequently Asked Questions on Spread betting
Recommended Broker for trading - MT4/5, web and mobile

IC Markets - offers market leading pricing and trading conditions by providing clients with True ECN Connectivity; this allows you to trade on institutional grade liquidity from the world’s leading investment banks, hedge funds and dark pool liquidity execution venues. Highly recommended!
Join my Membership for Trading Tips, Support and Resistance Levels with Live Trading
If you would like more detailed analysis for FTSE 100, DAX40, Gold and the S&P500, including the trades that I am looking to take myself, then please join my active members community.
Keep up to date with new website posts, free sign up below
