
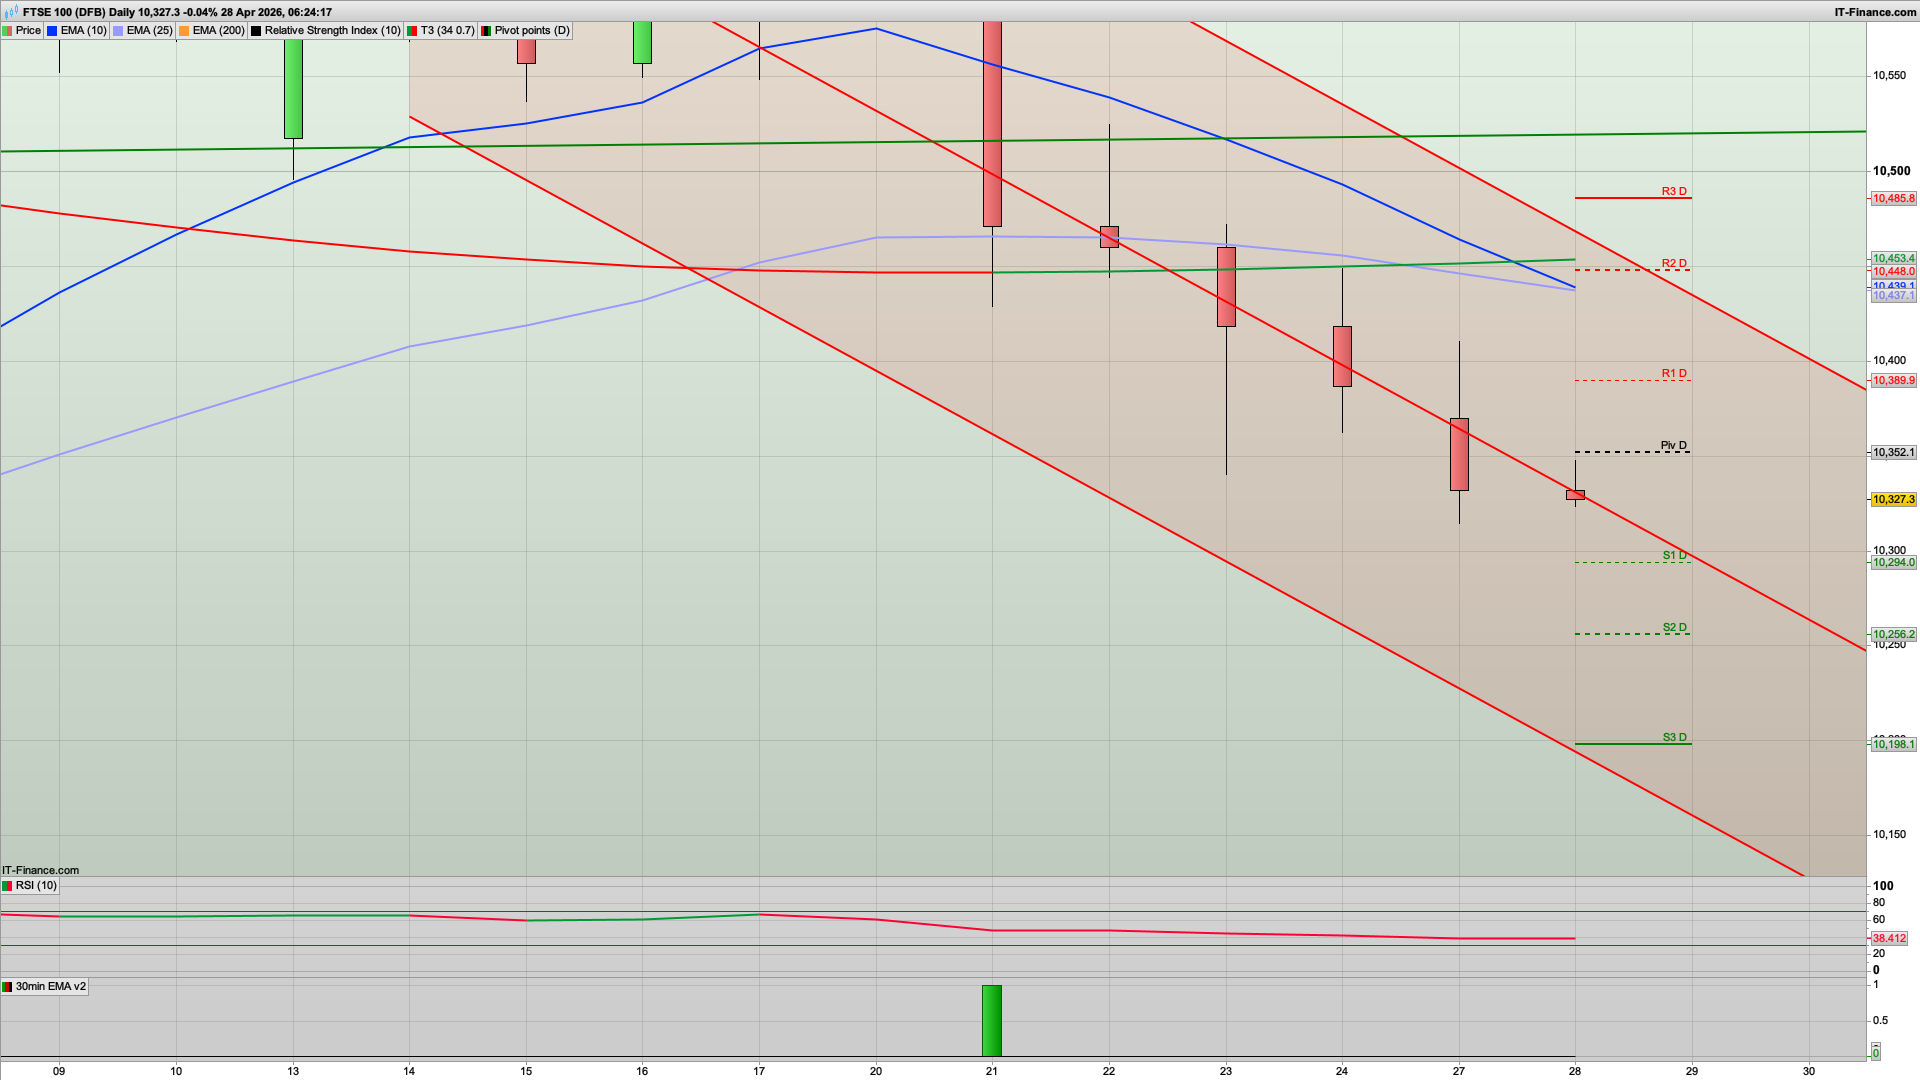
Technical analysis for 28th April 2026
FTSE 100
- Bias: Strong Bearish
- Clean downtrend channel
- Multiple strong red closes
- Below pivot (~10,350)
- Plan
- Sell rallies:
- 10,350–10,450
- Targets:
- 10,250 → 10,200
- Sell rallies:
- Still the cleanest short on the board
DAX (Germany 40)
- Bias: Bearish (weak structure)
- Sitting below pivot (~24,180)
- Repeated rejection from mid-range resistance
- Lower highs forming short-term
- Plan
- Sell rallies:
- 24,250–24,350
- Targets:
- 24,000 → 23,900
- Sell rallies:
- No momentum — but lean short while below pivot
NASDAQ (US Tech 100)
- Bias: Bullish (but stretched / pullback risk)
- Strong trend intact
- Small bearish candle at highs = pause, not reversal
- Still above pivot + channel
- Plan
- Buy dips:
- 27,000–27,100
- Avoid chasing highs
- Buy dips:
- Still best long market, just wait for pullbacks
S&P 500 (US 500)
- Bias: Mild Bullish → Range
- Holding above pivot
- Momentum slowing vs Nasdaq
- Grinding structure, not impulsive
- Plan
- Buy dips:
- 7,150 area
- Targets:
- 7,250+
- Buy dips:
- More range/balanced than strong trend
GOLD (XAUUSD)
- Bias: Bearish (trend intact)
- Still inside descending channel
- Below pivot (~4,700)
- Bounce attempts failing
- Plan
- Sell rallies:
- 4,700–4,740
- Targets:
- 4,620 → 4,580
- Sell rallies:
- Trend still down — rallies are selling opportunities
The stage is set for a bear Tuesday as the FTSE100 remains weak and shorting the rallies is still the best play for the moment. Even the pool price staying elevated isn't helping! Thats said yesterday's long did work out well....
We may well see an initial drop down this morning to test the 10300 and possibly the key fib at 10278 before the bulls attempt a rise towards the daily pivot area at 10350 - a level that looks to be worth a short and may well hold as today's high.
If the bulls were to break above the 10350 level then 10415 is the next key resistance area as we have the key fib and the 30m 200ema both here. The daily chart has also weakened considerably since the failure to break above 10700, and the EMAs are just about to cross back to a bearish mode. 10435 resistance on that indicator now as well.
10294 is S1 snd with the round number here, this could hold and we don't test the 10278 fib level so if it does bounce here then hop on the long.
Below the 10278 level then S2 at 10256 beacons, with the 10196 daily level below that. This level should see an initial bounce but if the bears continue to maintain the upper hand then we may well see a slide down to 10034 before any meaningful bounce.
It's looking similar for the DAX40 and S&P500 as well with a small dip, then a rise and then a dip again as bear Tuesday's play out across the board. Look for 24330 and 7200 as the main resistance levels respectively.
Good luck today.
Interested in how to start trading the FTSE 100? Frequently Asked Questions on Spread betting
Recommended Broker for trading - MT4/5, web and mobile

IC Markets - offers market leading pricing and trading conditions by providing clients with True ECN Connectivity; this allows you to trade on institutional grade liquidity from the world’s leading investment banks, hedge funds and dark pool liquidity execution venues. Highly recommended!
Join my Membership for Trading Tips, Support and Resistance Levels with Live Trading
If you would like more detailed analysis for FTSE 100, DAX40, Gold and the S&P500, including the trades that I am looking to take myself, then please join my active members community.
Keep up to date with new website posts, free sign up below
