
Technical analysis for 10th July 2026
We head into Friday’s session with markets trying to steady after a messy couple of days. The broader picture across equities hasn’t completely broken, but the tone is clearly less straightforward than it was earlier in the week. The FTSE held up better yesterday than it did on Wednesday’s sharp sell-off, with banks and miners helping offset weakness in AstraZeneca, while the DAX and S&P 500 continue to sit in broader uptrends even if near-term momentum has become less clean. Reuters noted that the FTSE 100 slipped only modestly on Thursday despite pressure from AstraZeneca, with strength in banks and mining stocks helping to cushion the index.
For me, that leaves today as a selective pullback session rather than a chase-the-open session. I still think the best setups are likely to come from letting price come back into support and then seeing whether buyers are willing to defend it. Gold remains the awkward one: it has safe-haven support in theory, but higher oil and sticky inflation worries are still making it difficult for bullion to trend cleanly.
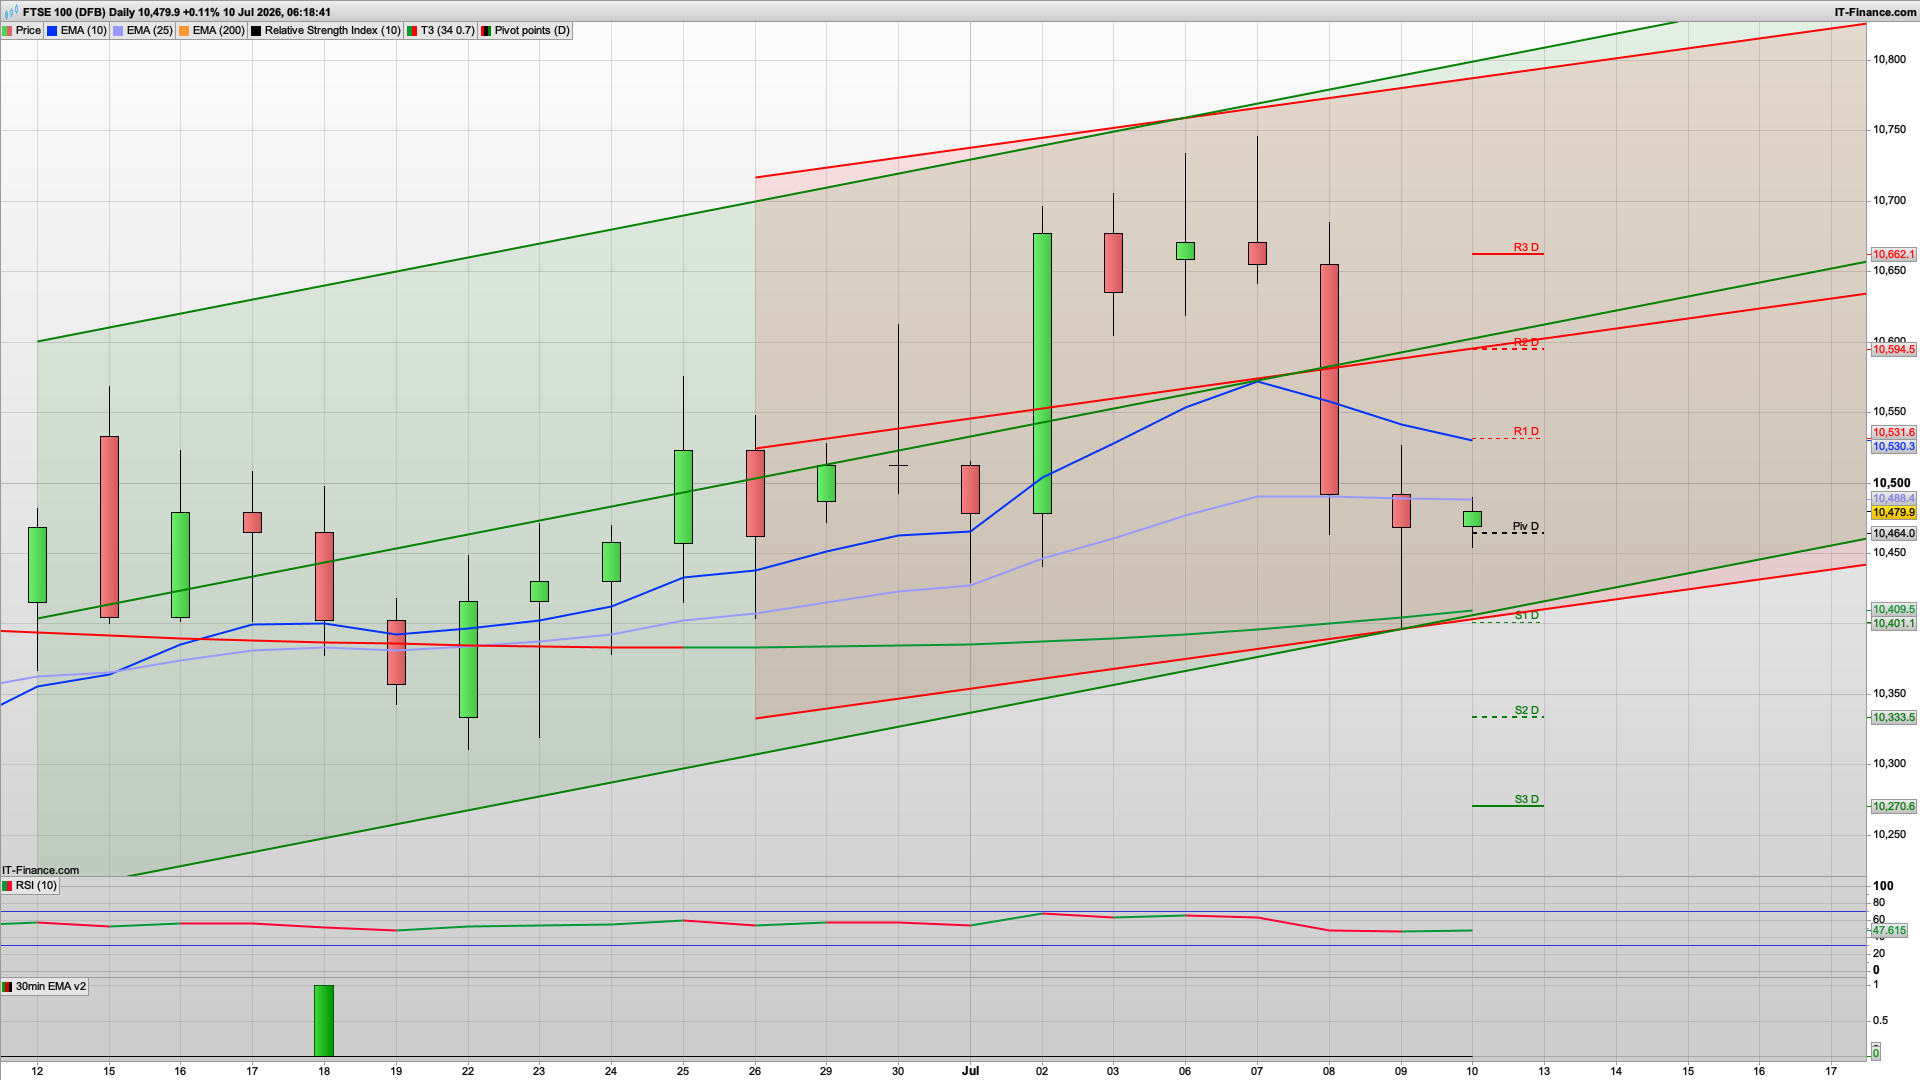
FTSE 100 — Neutral to slightly bearish
- Bias: still correcting after the rejection from the top of the channel
- FTSE is the one index I like least on the daily right now.
- It has sold off from the top of the rising channel and is now trading below the EMA25, with price still sitting under the 10,531–10,595 resistance zone.
- It is holding around the pivot/EMA200 area, so I’m not calling it outright bearish, but it looks more like a corrective chart than a trend continuation chart today.
- Bias call
- Neutral to slightly bearish while below 10,531
- If it reclaims 10,531 and starts holding above it, I’d neutralise that and look for recovery
- If it loses 10,410, I’d expect more downside into 10,334
- Bottom line
- Bias = weakest of the equity indices for me today. Not a clean long unless it gets back above resistance.
DAX40 — Neutral to slightly bullish
- Bias: holding support, but still needs a reclaim to become a proper trend long
- Stabilised after the sharp 7–8 July selloff.
- Yesterday held around the EMA200 / lower support band / pivot area, and today is opening with a small indecisive candle rather than further breakdown.
- The bigger structure is still a rising channel, so I don’t think this is a strong bearish daily chart yet.
- But price is also still below the EMA25 and below the 25,217–25,320 resistance zone, so it’s not a clean momentum long either.
- Bias call
- Neutral to slightly bullish while above 25,000 / pivot
- If it reclaims 25,217, I’d expect scope for a squeeze into 25,320 / 25,496
- Lose 25,000–24,940 and the chart turns softer again
- Bottom line
- Bias = mildly long if it holds pivot support, but it still needs confirmation through resistance.
Nasdaq 100 — Neutral to slightly bullish
- Bias: improving, but still inside a messy range
- Nasdaq put in a better green candle on 9 July after the washout on the 8th.
- Price has bounced back into the EMA cluster / pivot region, which improves the chart versus yesterday.
- However, it’s still not a strong trend chart because price is sitting in the middle of a broad range and under the heavier 29,914 / 30,108 resistance band.
- Bias call
- Neutral to slightly bullish while above 29,570
- If it can hold above pivot and break 29,914, then the daily picture improves a lot
- If it loses 29,570 and slips back under the EMA cluster, then it goes back to neutral/bearish quickly
- Bottom line
- Bias = modest long bias, but only just. It’s not a conviction daily chart yet.
S&P 500 — Bullish
- Bias: strongest of the set today
- S&P remains inside its rising channel and is holding above both the EMA25 and EMA200.
- The 9 July candle was a strong green push back up from support, and today is opening near the highs rather than rejecting them.
- Structurally this is the cleanest “trend continuation” chart of the indices right now.
- Bias call
- Bullish while above 7,497 / 7,522
- Best case is continuation toward 7,563, then 7,588
- Only a break back below 7,497 would weaken the setup materially
- Bottom line
- Bias = bullish / buy-the-dip. This is the best-looking long-bias chart of the group.
Gold — Neutral to slightly bullish
- Bias: trying to base around pivot / EMA area
- Gold has stopped looking as weak as it did a couple of days ago.
- Price is now sitting around the pivot and EMA25/EMA200 cluster, and the last two sessions show a stabilisation rather than a clean continuation lower.
- It’s still within a broader messy corrective structure, so I wouldn’t call it strongly bullish, but the outright bearish daily bias has eased.
- Bias call
- Neutral to slightly bullish while above 4,105 / 4,071
- A push through 4,156 would improve the chart and open 4,189
- Lose 4,071 and it turns weak again quickly
- Bottom line
- Bias = mildly positive / recovery bias, but it still needs a break of resistance to become a proper long.
Practical bias summary for today
- Best long-bias charts
- S&P 500 — strongest trend continuation setup
- Nasdaq — improving if it holds above pivot
- DAX — recovery long only if it can reclaim resistance
- Most cautious / weakest chart
- FTSE 100 — still looks corrective unless it gets back above 10,531
- Gold
- More of a mean-reversion / recovery chart than a strong trend chart right now
FTSE 100 Analysis
The FTSE has actually held up fairly well considering the geopolitical noise and the wobble we saw midweek. Yesterday’s price action suggested there is still underlying support in the market, particularly from financials and miners, and that matters because it tells me the sell-off hasn’t yet turned into a full risk-off unwind.
That said, I don’t think this is a market to chase after strength first thing this morning. The cleaner trade, in my view, still comes from a dip into support followed by evidence that buyers are stepping back in. If the FTSE can absorb early weakness and reclaim momentum, I’d still favour another leg higher into the end of the week.
- What I’m Watching
- An early retracement into support rather than an immediate breakdown.
- Buyers defending the most recent higher-low structure.
- Whether banks, miners and energy names continue to provide support if the broader tone stays cautious.
- Trading Plan
- I still prefer buying pullbacks rather than chasing the open.
- If the FTSE dips into support and stabilises, I’d be looking for long setups back with the broader trend. If support gives way cleanly and yesterday’s recovery tone disappears, then I’d step aside rather than forcing the bullish view too early.
DAX 40 Analysis
The DAX still looks constructive to me and, structurally, it remains one of the cleaner equity charts of the four markets we’re covering. It hasn’t escaped the recent volatility, but it also hasn’t done enough technical damage to make me want to fight the broader trend.
For today, I think the most likely opportunity is still the same one we’ve been looking for most of the week: a controlled dip into support followed by a recovery. If that higher-low structure keeps holding, I’d still favour another push higher rather than a deeper unwind.
- What I’m Watching
- A controlled pullback into support rather than a sharp risk-off move.
- Buyers defending recent higher lows.
- A move back through the overnight range to rebuild intraday momentum.
- Trading Plan
- The plan remains to buy dips while the bullish structure stays intact.
- I’d rather wait for the DAX to come back into value than chase it after a strong first move. If support starts failing cleanly, then I’d reassess, but for now it still looks like a market where weakness is more likely to be an opportunity than a warning.
S&P 500 Analysis
The S&P 500 still sits in a broader uptrend, but I do think it’s become less straightforward over the last couple of sessions. The easy momentum higher has faded a little, and after such a strong run the market looks like it may need to work harder for the next leg up.
That doesn’t mean I’m bearish on it — far from it. It just means I want the market to prove it still wants to buy dips before getting too aggressive. If futures pull back into support and buyers respond, I’d still favour the long side. If we get another choppy session with no real follow-through, then I’d be happy to leave it alone rather than overtrade a market that may just be consolidating.
- What I’m Watching
- Whether futures can hold above the recent support band.
- Any early weakness being bought rather than accelerating lower.
- Signs that the market still wants to grind higher rather than roll into a deeper correction.
- Trading Plan
- I still favour buying retracements, but I’d be more selective here than on the FTSE or DAX.
- If the S&P gives a controlled dip into support and buyers step back in, I’d still lean long. If price remains messy and directionless, then patience is the better trade.
Gold Analysis
Gold is still the least straightforward market of the four for me. On paper, the geopolitical backdrop should be helping it, but the problem is that higher oil prices and lingering inflation concerns are also keeping rate expectations elevated, and that continues to cap the upside.
So while I’m not aggressively bearish on Gold in the way I was earlier in the move, I’m also not convinced it’s a clean long market yet. For me, it still looks more tactical than directional. If it pushes into resistance and stalls, I’d still be wary of it fading. If buyers can hold a pullback and build momentum, then the tone improves — but I’d still want confirmation rather than anticipation.
- What I’m Watching
- Whether Gold can hold above recent support on any pullback.
- Any rally into resistance that starts to stall.
- Whether buyers can actually sustain momentum rather than just produce another short-lived bounce.
- Trading Plan
- For now I’m neutral to slightly bearish on Gold.
- If it rallies into resistance and fails to hold gains, I’d still be more interested in fade setups than chasing longs. If, however, Gold starts reclaiming resistance and holding above it, I’d soften that view quickly and reassess the upside.
Final Thoughts
For today, I still think the equity indices are the cleaner opportunities, but I’m not treating this as a session to chase strength blindly. The FTSE has held up better than Wednesday’s sell-off might have suggested, the DAX still looks technically constructive, and the S&P 500 remains bullish in the bigger picture even if the short-term price action has become a little more selective. Gold remains the difficult one. It’s not weak enough to be an easy short, but it’s not yet strong enough to be a clean long either. Until that changes, I still think it’s a market to trade tactically rather than emotionally.
Good luck today and have a great weekend.
Interested in how to start trading the FTSE 100? Frequently Asked Questions on Spread betting
Recommended Broker for trading - MT4/5, web and mobile

IC Markets - offers market leading pricing and trading conditions by providing clients with True ECN Connectivity; this allows you to trade on institutional grade liquidity from the world’s leading investment banks, hedge funds and dark pool liquidity execution venues. Highly recommended!
Join my Membership for Trading Tips, Support and Resistance Levels with Live Trading
If you would like more detailed analysis for FTSE 100, DAX40, Gold and the S&P500, including the trades that I am looking to take myself, then please join my active members community.
Keep up to date with new website posts, free sign up below