
Technical analysis for 15th July 2026
Well, the markets managed to shake off the geopolitical concerns yesterday and we head into Wednesday with the bulls trying to regain control. The big catalyst was US inflation. US June CPI came in softer than expected and that immediately eased some of the concerns that the Federal Reserve would need to raise interest rates again in the near term. That was exactly what the equity markets wanted to hear.
The S&P 500 and Nasdaq both finished higher, with technology stocks leading the recovery, while strong results from the major US banks also helped improve sentiment.
The FTSE 100 was particularly impressive. Despite opening under pressure as oil prices remained elevated, the index recovered throughout the session and eventually closed higher around the 10529 area. That tells us buyers are still prepared to step in on weakness.
The geopolitical situation in the Middle East hasn't disappeared, and oil remains the biggest risk to the bullish outlook, but for now the softer inflation data has given equity markets some breathing room.
Gold remains the difficult market. After the aggressive sell-off at the start of the week, the metal is trying to stabilise around the $4000 area, but buyers still haven't done enough to convince me that the trend has properly changed.
For today, I think the key question is whether yesterday's recovery can continue. The clearest split for me is bullish US indices versus weaker Gold. The DAX is improving but still has resistance overhead, while the FTSE remains trapped and indecisive.
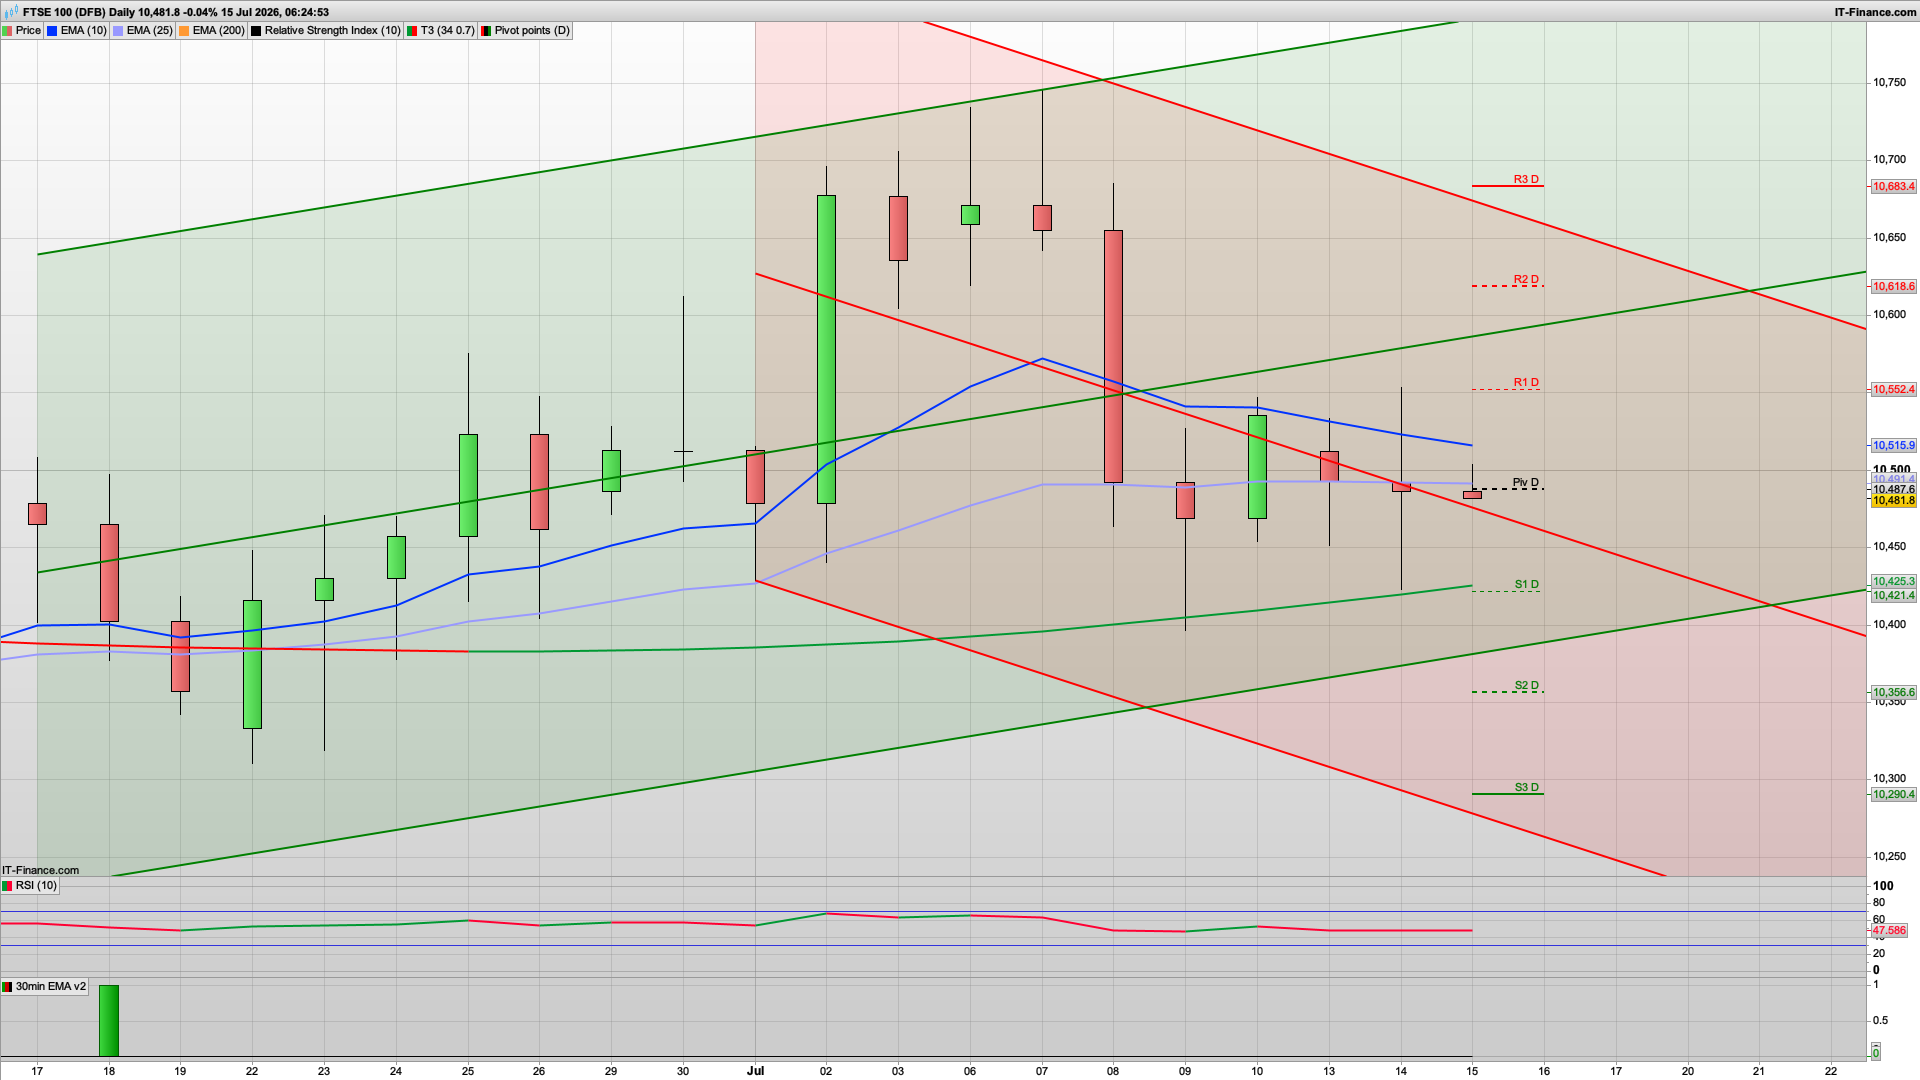
FTSE 100 — NEUTRAL / SLIGHTLY BEARISH
- Price is around 10,482, sitting almost directly on the EMA25 and just below the daily pivot around 10,491.
- The falling EMA10 at 10,516 and descending red trend resistance continue to cap the market.
- However, support around 10,420–10,425 is also holding.
- That means the FTSE is effectively trapped between support and resistance.
- My preference is to sell a failed rally into 10,500–10,520.
- The downside targets would be 10,425 S1, followed by 10,357 S2.
- A clean break above 10,525 would invalidate the bearish view and open 10,552 R1.
DAX 40 — SLIGHTLY BULLISH
- The DAX has improved from yesterday.
- Price is around 25,059 and has moved back above the 25,018 daily pivot and EMA200 around 25,040. The recent candles show the market repeatedly defending the rising green support structure around 24,900–24,950.
- The problem is the falling EMA10 around 25,128 and the descending red trend line directly overhead.
- That gives me a slight bullish bias, but I don't want to chase price straight into resistance.
- My preferred scenario is a dip towards 25,020–24,950 that holds, followed by a push towards 25,128, then 25,248 R1.
- A clean break above 25,130 would strengthen the bullish view considerably.
- Below 24,945, I would switch back bearish and look towards 24,814 S1.
Nasdaq 100 — BULLISH
- Nasdaq has now become much more interesting.
- Yesterday's strong bullish candle has decisively reclaimed the EMA cluster around 29,593–29,630, and price is trading around 29,793.
- The index is also comfortably above the 29,599 daily pivot.
- Structurally, this looks like a bullish recovery from the lower part of the broader channel.
- The immediate upside target is 30,033 R1.
- Above there, 30,254 R2 becomes possible.
- My preferred setup is to buy a pullback into 29,630–29,600.
- If buyers defend that EMA/pivot area, I would look for continuation towards 29,900–30,033.
- A break back below 29,590 would weaken the setup.
S&P 500 — BULLISH
- The S&P remains the strongest technical chart of the five.
- Price is around 7,560 and remains comfortably above the daily pivot at 7,541, EMA10 at 7,524, and EMA25 around 7,484.
- The rising channel structure remains intact and yesterday's strong bullish candle confirms buyers are still aggressively buying weakness.
- The immediate resistance area is around 7,575–7,590.
- Above 7,590 R1, the next target is 7,615 R2, followed by 7,663 R3.
- My preferred trade is to buy a dip towards 7,540–7,525.
- Ideally, I want to see a 30-minute bullish reaction from that area.
- The bearish trigger would be a sustained break below 7,515.
Gold — BEARISH
- Gold remains my clearest short bias.
- Price is around 4,027 and continues to trade beneath the falling EMA10 at approximately 4,074.
- The broader descending channel remains intact.
- Yesterday's recovery failed to establish price above the descending trend resistance and today's candle is already showing renewed selling pressure.
- The daily pivot around 4,045 is now important resistance.
- My preferred setup is to sell a rally into 4,040–4,050.
- A stronger rally towards 4,065–4,075 would potentially offer an even better short entry.
- The downside targets are 3,988 S1, then 3,926 S2.
- If selling accelerates, 3,869 S3 is the larger downside target.
- A sustained break above 4,075 would make me reconsider the bearish bias.
My two clearest directional ideas
- LONG: S&P 500 — I favour buying a confirmed hold around 7,525–7,540, targeting 7,575–7,590, then 7,615.
- SHORT: Gold — I favour selling a rejection around 4,040–4,050, targeting 3,988, then 3,926.
For today's session, I would be looking to buy weakness on the S&P and Nasdaq rather than chase the opening strength. The S&P remains the cleanest long chart, while Gold remains the cleanest short.
One thing I would watch closely is the S&P 7,540 area. If that holds on the first decent pullback, I think that's potentially the primary trade of the day.
Good luck today.
Interested in how to start trading the FTSE 100? Frequently Asked Questions on Spread betting
Recommended Broker for trading - MT4/5, web and mobile

IC Markets - offers market leading pricing and trading conditions by providing clients with True ECN Connectivity; this allows you to trade on institutional grade liquidity from the world’s leading investment banks, hedge funds and dark pool liquidity execution venues. Highly recommended!
Join my Membership for Trading Tips, Support and Resistance Levels with Live Trading
If you would like more detailed analysis for FTSE 100, DAX40, Gold and the S&P500, including the trades that I am looking to take myself, then please join my active members community.
Keep up to date with new website posts, free sign up below