
Technical analysis for 4th August 2026
We head into Tuesday with markets trying to build on yesterday's positive start to the month. Wall Street finished strongly after better-than-expected US manufacturing data reinforced the view that the American economy continues to expand despite higher interest rates. That helped push the S&P 500 back towards record territory and lifted sentiment across global equity markets overnight.
However, today's backdrop is slightly more balanced. The focus has shifted away from geopolitics and back towards interest rates.
Japanese government bond yields moved higher overnight after weak demand at a 10-year auction, reminding investors that global borrowing costs remain elevated even as oil prices ease. The good news is that Brent crude remains well below the highs we saw during the recent Middle East tensions. That continues to reduce pressure on inflation expectations and gives equity markets some breathing room.
Today's key events are the US JOLTS job openings report and factory orders, both of which will help shape expectations ahead of Friday's US employment report.
The technical picture has changed very little from yesterday. European indices continue to lead higher, the US indices are testing important resistance after their rebound, and Gold remains range-bound with no strong directional edge.
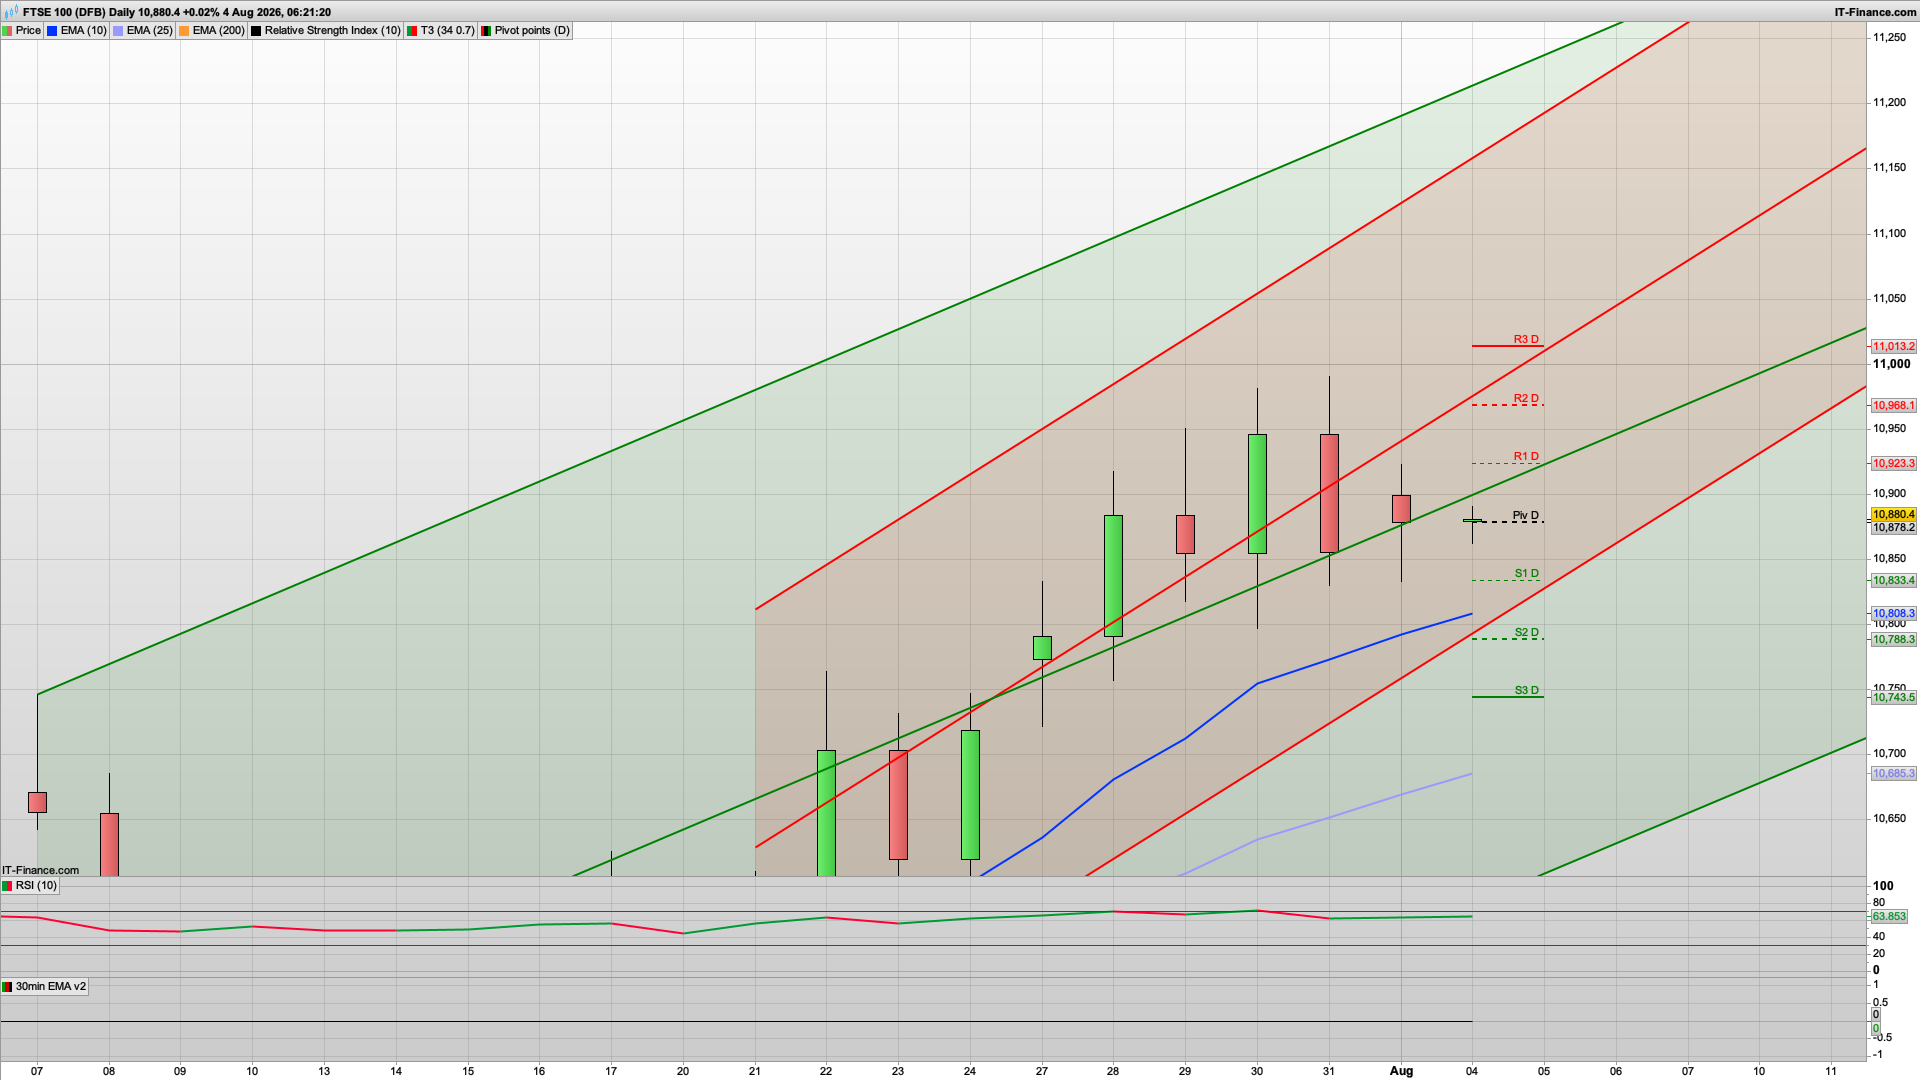
FTSE 100
Bias: Bullish
- The FTSE continues to outperform despite recent consolidation.
- Technical Picture
- Uptrend remains intact.
- Holding comfortably above both moving averages.
- Small indecision candles after the recent advance suggest consolidation rather than reversal.
- Relative Strength remains positive.
DAX 40
Bias: Bullish
- The DAX remains one of the strongest charts.
- Technical Picture
- Strong sequence of higher highs and higher lows.
- Price remains comfortably above the 10 EMA and 25 EMA.
- Trading inside the upper half of the rising channel.
- RSI has pushed above 70, suggesting strong momentum but a short-term overbought condition.
S&P 500
Bias: Bullish
- This chart has improved noticeably.
- Technical Picture
- Strong bullish candle has broken back above both moving averages.
- Price is now challenging the upper channel.
- Momentum indicator continues to strengthen.
- Buyers remain in control unless price loses the Pivot.
Gold
Bias: Neutral
- Gold continues to move sideways with no clear trend.
- Technical Picture
- Price sits almost exactly on the Pivot.
- 10 EMA and 25 EMA are flattening.
- Multiple alternating candles suggest equilibrium.
- Neither buyers nor sellers have control.
- Trading Plan
- No high-conviction trade.
- Bullish only above:
- 4,082
- Bearish below:
- 4,050
- Otherwise expect continued range trading.
Nasdaq 100
Bias: Neutral to Bullish
- The Nasdaq is continuing to recover but is approaching major overhead resistance.
- Technical Picture
- Trading back above the 10 EMA.
- Price is approaching the descending channel resistance.
- 25 EMA still overhead.
- Momentum improving but breakout not yet confirmed.
- Trading Plan
- A sustained close above 28,900 would signal further upside.
- Otherwise expect:
- pullback toward Pivot
- consolidation before another attempt higher.
Strength Ranking
- DAX 40 – Strongest trend, firmly within its rising channel and maintaining higher highs.
- FTSE 100 – Healthy uptrend with buyers consistently defending support.
- S&P 500 – Momentum has improved significantly after reclaiming key moving averages.
- Nasdaq 100 – Recovering well, but still needs to clear descending resistance to confirm a broader trend reversal.
- Gold – Directionless and trapped in a consolidation range.
Overall Market View
The broader market tone remains constructive. European equities continue to lead, with the DAX40 and FTSE 100 maintaining strong uptrends and offering the highest-probability opportunities on intraday pullbacks. The S&P 500 has improved enough to shift back to a bullish bias after reclaiming key technical levels, while the Nasdaq 100 is close to confirming a larger breakout but still faces meaningful resistance. Gold remains the weakest chart, continuing to consolidate without a clear directional advantage.
Interested in how to start trading the FTSE 100? Frequently Asked Questions on Spread betting
Recommended Broker for trading - MT4/5, web and mobile

IC Markets - offers market leading pricing and trading conditions by providing clients with True ECN Connectivity; this allows you to trade on institutional grade liquidity from the world’s leading investment banks, hedge funds and dark pool liquidity execution venues. Highly recommended!
Join my Membership for Trading Tips, Support and Resistance Levels with Live Trading
If you would like more detailed analysis for FTSE 100, DAX40, Gold and the S&P500, including the trades that I am looking to take myself, then please join my active members community.
Keep up to date with new website posts, free sign up below