
Technical analysis for 3rd August 2026
The broad picture remains constructive for the European markets, while the US indices are approaching major resistance and Gold continues to lack directional conviction.
We begin August with a much more positive tone than we finished July while the biggest development over the weekend has been the dramatic shift in the Middle East. Rather than launching further military action, the United States has opened diplomatic talks with Iran aimed at easing tensions and reopening shipping through the Strait of Hormuz.
The market's reaction has been immediate:
- Oil has fallen sharply.
- Treasury yields have eased.
- The US dollar has weakened.
- Equity futures have moved higher.
After several weeks where geopolitical headlines dominated trading, investors finally have an opportunity to focus on the fundamentals again. Negotiations remain fragile, this is still a data-heavy week with the US employment report due on Friday, and investors will continue watching central bank expectations closely. However, compared with the final week of July, today's backdrop is clearly more supportive for risk assets.
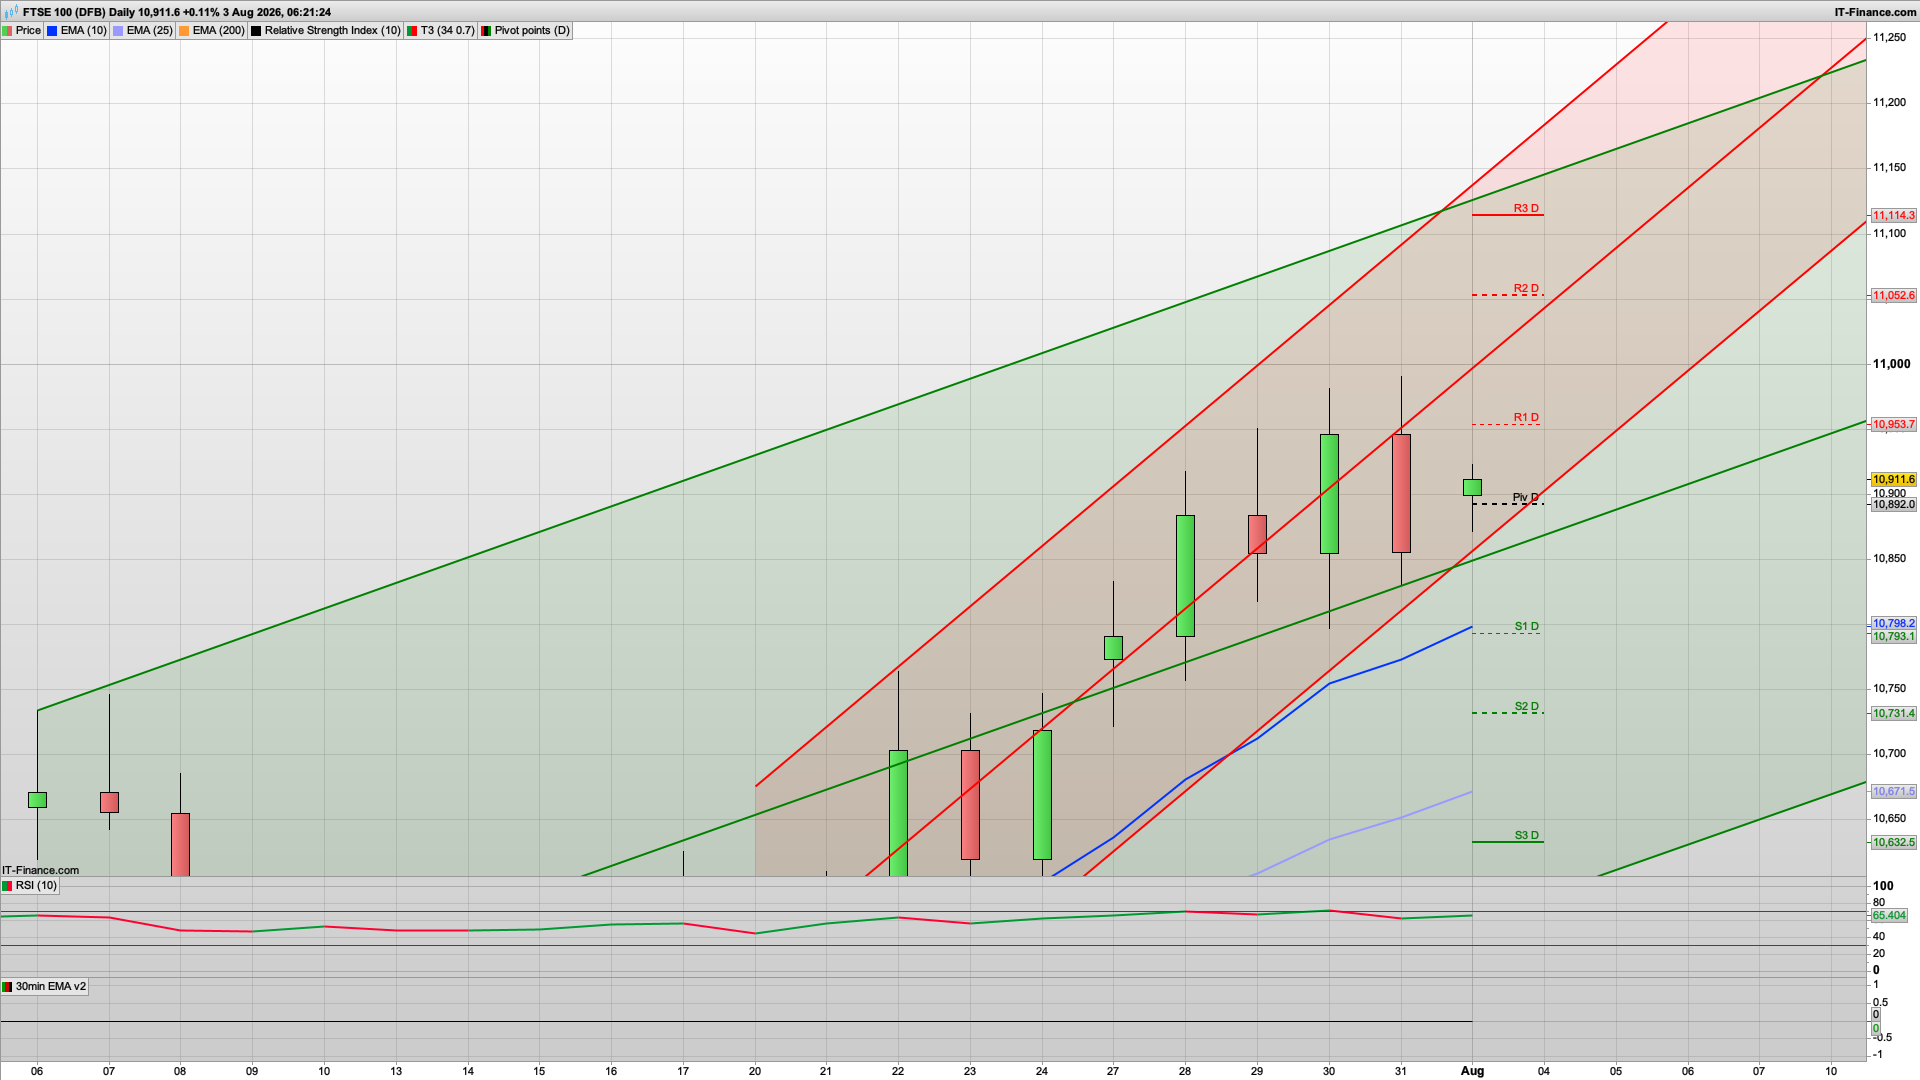
FTSE 100
Bias: Bullish
- The FTSE remains one of the strongest charts despite a brief consolidation after Friday's profit-taking.
- Technical picture
- Trend channel remains firmly higher.
- Price continues above the 10 EMA and 25 EMA.
- Higher lows continue to develop.
- RSI around 65, leaving room for another push higher.
DAX 40
Bias: Bullish
- The DAX continues to produce higher highs and higher lows inside the rising trend channel.
- Technical picture
- Strong trend remains intact.
- Trading above both the 10 EMA and 25 EMA.
- RSI around 68, showing healthy momentum but approaching overbought territory.
- Price is now challenging the R1 pivot area.
- A close below the Pivot and 10 EMA would weaken the short-term bullish outlook.
Nasdaq 100
Bias: Neutral
- The Nasdaq has rallied into the upper boundary of its falling channel but is stalling directly beneath key resistance.
- Technical picture
- Price is sitting on the descending trendline.
- Still below the 25 EMA and 200 EMA.
- Recovery has improved sentiment but no confirmed breakout yet.
- Today's candle suggests hesitation rather than strong follow-through.
- Trading plan
- This is a decision point.
- A daily close above 28,550 would strengthen the bullish case.
- Failure here could see price rotate back towards the Pivot.
- For now, avoid chasing longs into resistance.
S&P 500
Bias: Neutral to Bullish
- The S&P continues to recover but has reached the top of the descending channel and is trading around R1.
- Technical picture
- Trading above the 10 EMA.
- Short-term momentum improving.
- However, price is now testing a cluster of resistance from the channel top and pivot resistance.
- The next move depends on whether buyers can achieve a breakout.
- Trading plan
- Preferred strategy:
- Buy pullbacks into 7,460–7,420.
- Avoid buying directly into R1 resistance.
- A close above 7,525 would improve the outlook significantly.
Gold
Bias: Neutral to Slightly Bearish
- Gold remains trapped in a broad sideways range and continues to reject attempts above the Pivot.
- Technical picture
- Trading around the 10 EMA and 25 EMA.
- Mixed candle sequence with no clear trend.
- Unable to sustain rallies above the Pivot.
- Momentum remains weak compared with equities.
- Trading plan
- Slight preference is to fade rallies while price remains below 4,096.
- Bullish only if price closes above 4,100.
- Below 4,050, the risk shifts towards a retest of 4,005.
Overall Market View
The daily charts continue to favour European equities, with both the DAX and FTSE 100 maintaining well-defined uptrends and offering the clearest buying opportunities on pullbacks. In the US, both the S&P 500 and Nasdaq 100 have recovered but are now testing significant technical resistance, making patience preferable until either a breakout or a retracement develops. Gold remains range-bound and continues to underperform, with no confirmed directional edge at present.
Interested in how to start trading the FTSE 100? Frequently Asked Questions on Spread betting
Recommended Broker for trading - MT4/5, web and mobile

IC Markets - offers market leading pricing and trading conditions by providing clients with True ECN Connectivity; this allows you to trade on institutional grade liquidity from the world’s leading investment banks, hedge funds and dark pool liquidity execution venues. Highly recommended!
Join my Membership for Trading Tips, Support and Resistance Levels with Live Trading
If you would like more detailed analysis for FTSE 100, DAX40, Gold and the S&P500, including the trades that I am looking to take myself, then please join my active members community.
Keep up to date with new website posts, free sign up below