
Technical analysis for 26th February 2026
FTSE 100 — Bullish but stretched (late-trend)
- Clean impulsive move to channel highs
- Strong relative strength
- EMA stack wide (momentum strong)
- Small rejection candle → more likely pause than reversal
- Bias: Bullish – continuation after shallow pullbacks
- Not a good short unless channel breaks.
DAX40 — Bullish (trend continuation)
- What changed:
- Holding the channel midline as support
- Price still above the rising EMA cluster
- Pullback candle into pivot = healthy correction, not reversal
- Higher-low structure intact
- Bias: Buy dips
- Only turns neutral below S1 / EMA base + channel mid.
S&P 500 — Bullish recovery inside larger down-channel
- Key shift today:
- Strong bullish push back above pivot
- Reclaiming short EMAs
- Building higher lows
- Room toward R1 → R2 / channel top
- Macro trend is still down, but today’s flow = long side.
- Bias: Intraday bullish / buy dips above pivot
GOLD — Bullish continuation
- Strong reclaim of pivot
- Trend channel holding
- EMA support below price
- Higher-low → higher-high sequence intact
- Bias: Buy dips toward pivot / S1 for continuation to R1 → R2
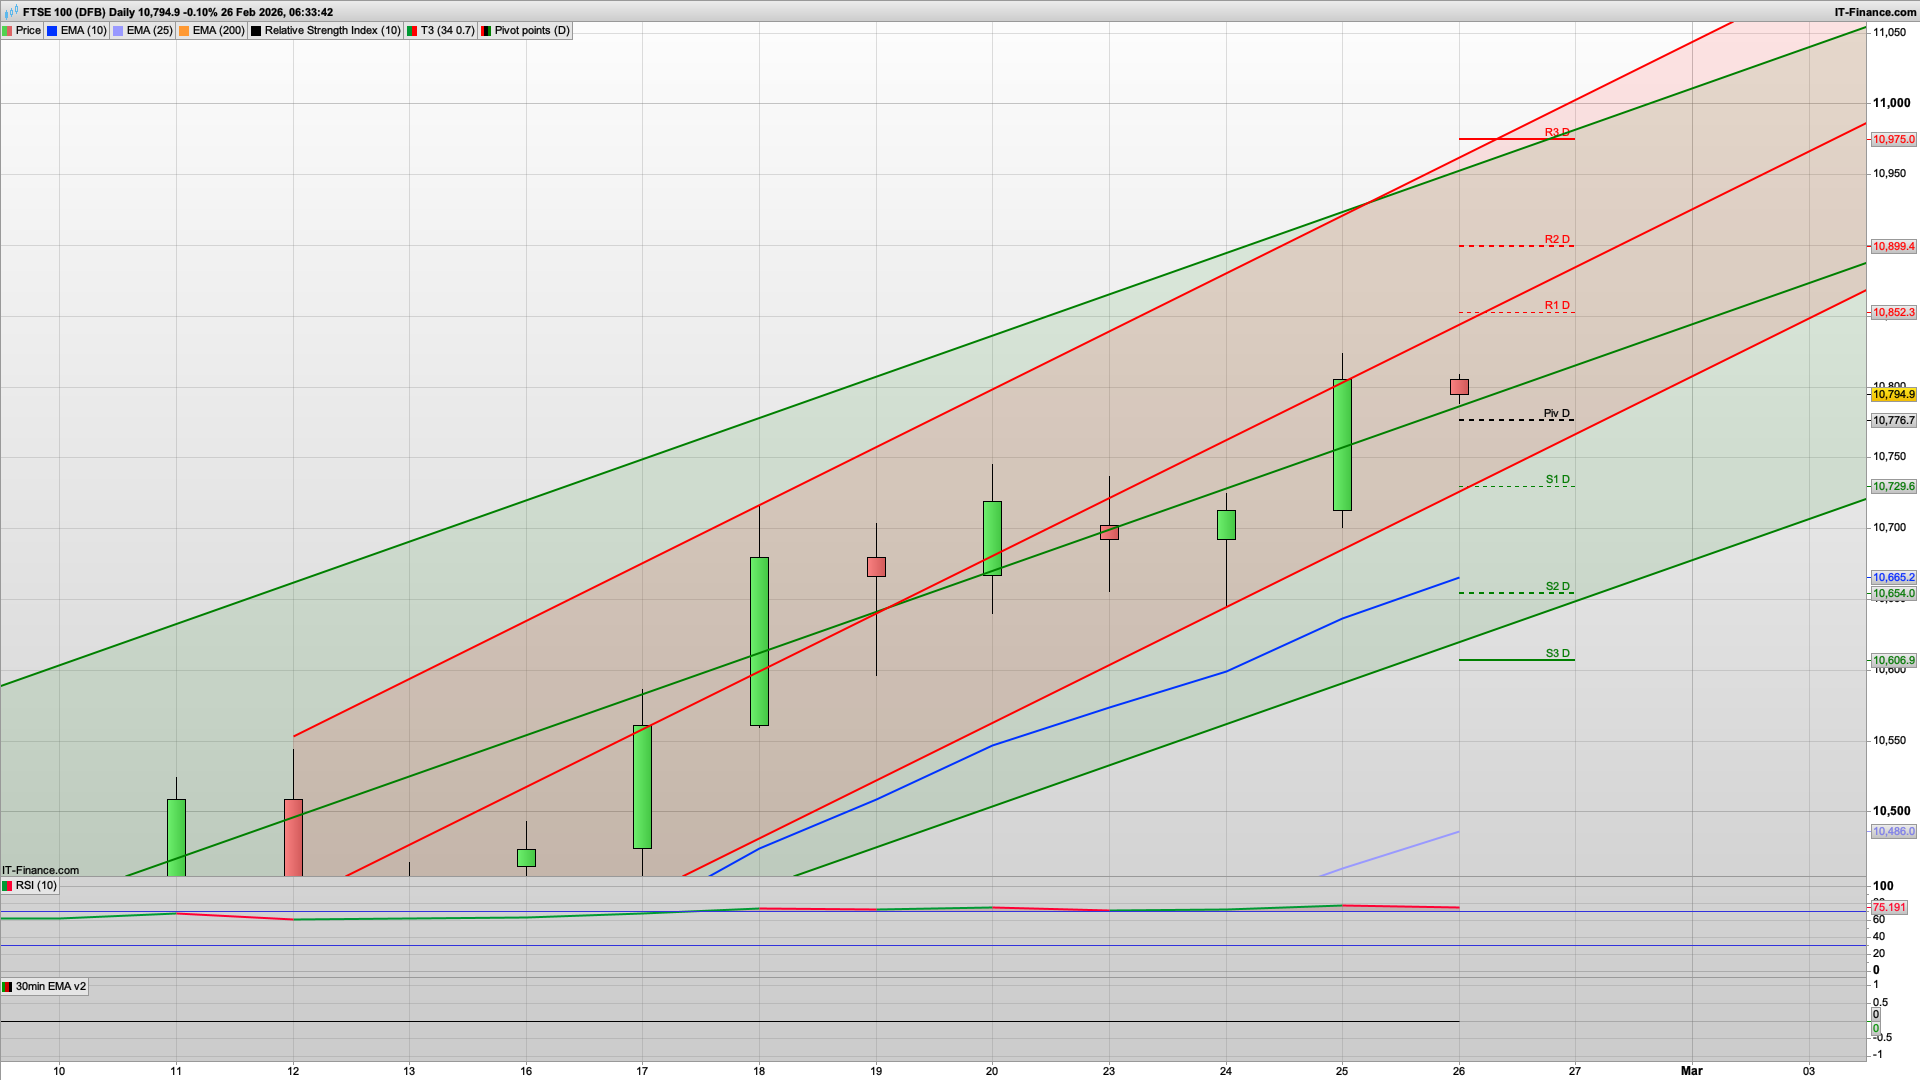
Today we have the daily pivot at 10776 as the main support to start with and the bulls will be looking to push back up past 10800 again today. Last night saw a test of the 10823 level so they will be looking to break above that today while the momentum remains bullish across the board at the moment., The 2h chart is positive still, with Hull MA support at 10780 adding weight to this level.
If the bulls can push on today then I am looking at a rise towards the 10850 area and a test of R1 and the key fib, with an outside chance of a test of R2 at 10899. Seems a bit bonkers to be talking of that level as it wasn't that long again we were at 9300 but anyway.... 11000 is also tantalisingly close!
If the bears were to break the 10770 level though then we will likely see a drop down to the 10715 area and just below S1 (10729) as we have the 30m 200ema and key fib here. The bottom of the 10 day Raff channel is also at 10730 so this area should in theory be good support. There isn't any sign of aggressive shorting as yet, nor major profit taking, with most bulls content to just hold on for the moment. They will also be looking for the S&P500 to rise further to retest the 7000 level again. That in turn will help other markets rise further.
Generally as per all this week its looking bullish still and buying the dips is still the preferred play.
Good luck
Interested in how to start trading the FTSE 100? Frequently Asked Questions on Spread betting
Recommended Broker for trading - MT4/5, web and mobile

IC Markets - offers market leading pricing and trading conditions by providing clients with True ECN Connectivity; this allows you to trade on institutional grade liquidity from the world’s leading investment banks, hedge funds and dark pool liquidity execution venues. Highly recommended!
Join my Membership for Trading Tips, Support and Resistance Levels with Live Trading
If you would like more detailed analysis for FTSE 100, DAX40, Gold and the S&P500, including the trades that I am looking to take myself, then please join my active members community.
Keep up to date with new website posts, free sign up below
