
Technical analysis for 27th February 2026
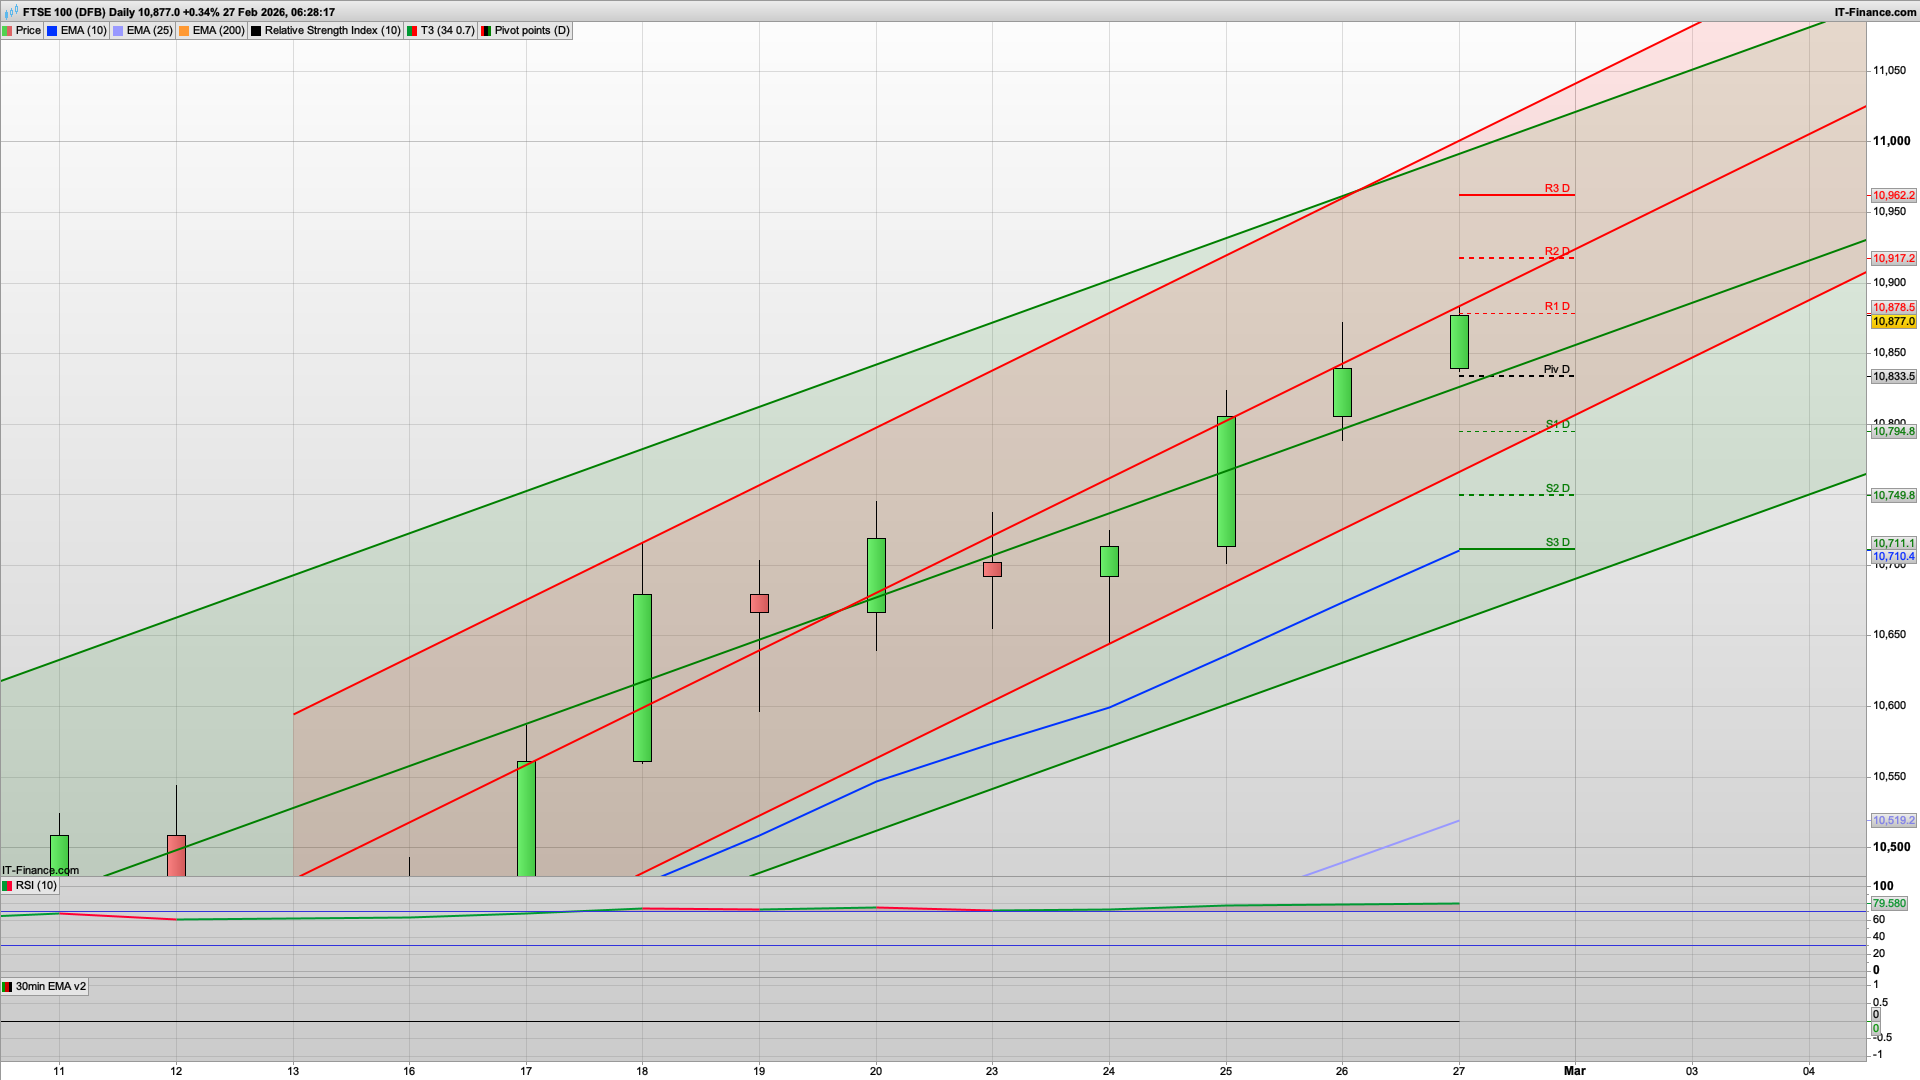
FTSE 100 — Strong bullish continuation
- Impulsive breakout candle
- Trading near channel highs
- Strong EMA separation = momentum trend
- Pivot well below price
- Bias: Buy dips
- This is the strongest index again today.
DAX — Bullish continuation
- Clean higher-high / higher-low trend
- Riding the channel midline as support
- Price holding above all EMAs
- Pivot sitting below price → support
- Bias: Buy dips → continuation toward R1 / R2
- Only neutral if price loses 25,11x zone (EMA + S1 area).
S&P 500 — Neutral / range with slight bullish pressure
- Still inside the larger descending structure
- Price back under R1 and sitting around pivot
- EMAs flat → no trend expansion
- Momentum not impulsive
- Bias: Range trade
- Above pivot → small long scalp bias
- Below pivot → sell back to S1
- (No strong trend day signal yet.)
GOLD — Bullish continuation (steady trend)
- Trend structure intact
- Price holding above pivot + rising EMA support
- Series of higher lows
- No rejection from resistance yet
- Bias: Buy pullbacks → continuation to R1 / R2
One-line trading bias
Bullish above 10,835 → targeting 10,917 today.
Well the bulls are continuing to reign supreme but we are getting close to the key 10900 level now and starting to look a little bit over extended. As its month end and also Friday we may well see some profit taking ahead of the weekend, and the 10910 area looks like a good spot for this to happen at. We have the key fib and R2 here, as well as being just above the round number.
The main trade first thing though will be to buy any dip down to the daily pivot support at the 10833 level. I would like to see this hold for a test of the 10900 level.
If the bulls were to break above the 10917 R2 level today then we can look for a rise towards R3 at 10962 and also then tantalisingly close to the 11000 level! That said, I think I am more inclined to go with a break of 10900 failing today ahead of the weekend and then a push from the bulls on Monday, assuming no major negative news over the weekend effecting the markets.
Support wise, below the 10833 daily pivot then look for 10760 which is the bottom of the 10d Raff channel along with the 30m 200ema and the key fib. This area should hold if seen though it probably won't get that low (famous last words).
Lower down the next daily support is at 10740 though it will probably need an element of panic to kick in to start thinking about getting that low today.
At 1330 today we have the US PPI so we may well see some volatility then.
Good luck today and have a great weekend.
Interested in how to start trading the FTSE 100? Frequently Asked Questions on Spread betting
Recommended Broker for trading - MT4/5, web and mobile

IC Markets - offers market leading pricing and trading conditions by providing clients with True ECN Connectivity; this allows you to trade on institutional grade liquidity from the world’s leading investment banks, hedge funds and dark pool liquidity execution venues. Highly recommended!
Join my Membership for Trading Tips, Support and Resistance Levels with Live Trading
If you would like more detailed analysis for FTSE 100, DAX40, Gold and the S&P500, including the trades that I am looking to take myself, then please join my active members community.
Keep up to date with new website posts, free sign up below
