
Technical analysis for FTSE 100 for 21st September 2023
The FTSE 100 closed at its highest level in four months after the surprise drop in inflation last month. Britain’s blue-chip index has gained 0.93pc today to close at 7,731.65, its highest level since May. The FTSE 250 closed up 1.55pc at 18,712.37.
Stocks in Asia fell and the dollar strengthened Thursday after the Federal Reserve signaled interest rates will be higher for longer. Benchmark indexes declined, with a regional equity gauge set to post its biggest loss in almost a month. The MSCI China Index fell 1.4% and headed for the lowest close since November as pessimism persisted about the nation’s economic recovery. Tech stocks in Hong Kong slid over 2%, following losses on Wall Street, with contracts for US benchmarks drifting lower in Asian trading.
Bank of England policy makers will decide today whether to call a halt to a string of 14 consecutive interest-rate increases, with investors and handful of economists raising doubts about another hike. Investors have still fully priced in one more quarter-point increase this year in the UK central bank’s base rate, which is now 5.25%. But a drop in inflation to an 18-month low announced Wednesday raised questions over whether the BOE will deliver that hike today.
The overall tone of the Fed's latest meeting was not overly hawkish but there were two surprises. Forecasts for 2024 were slightly higher than generally expected and Fed statements implied the view that macroeconomic growth would hold up even if with rates staying higher for longer.
The U.S. central bank held interest rates on Wednesday and projected an increase by year-end, saying monetary policy is likely to be significantly tighter through 2024 than previously thought. The median forecast for the federal funds rate is 5.1% by year-end, versus 4.6% estimated in June.
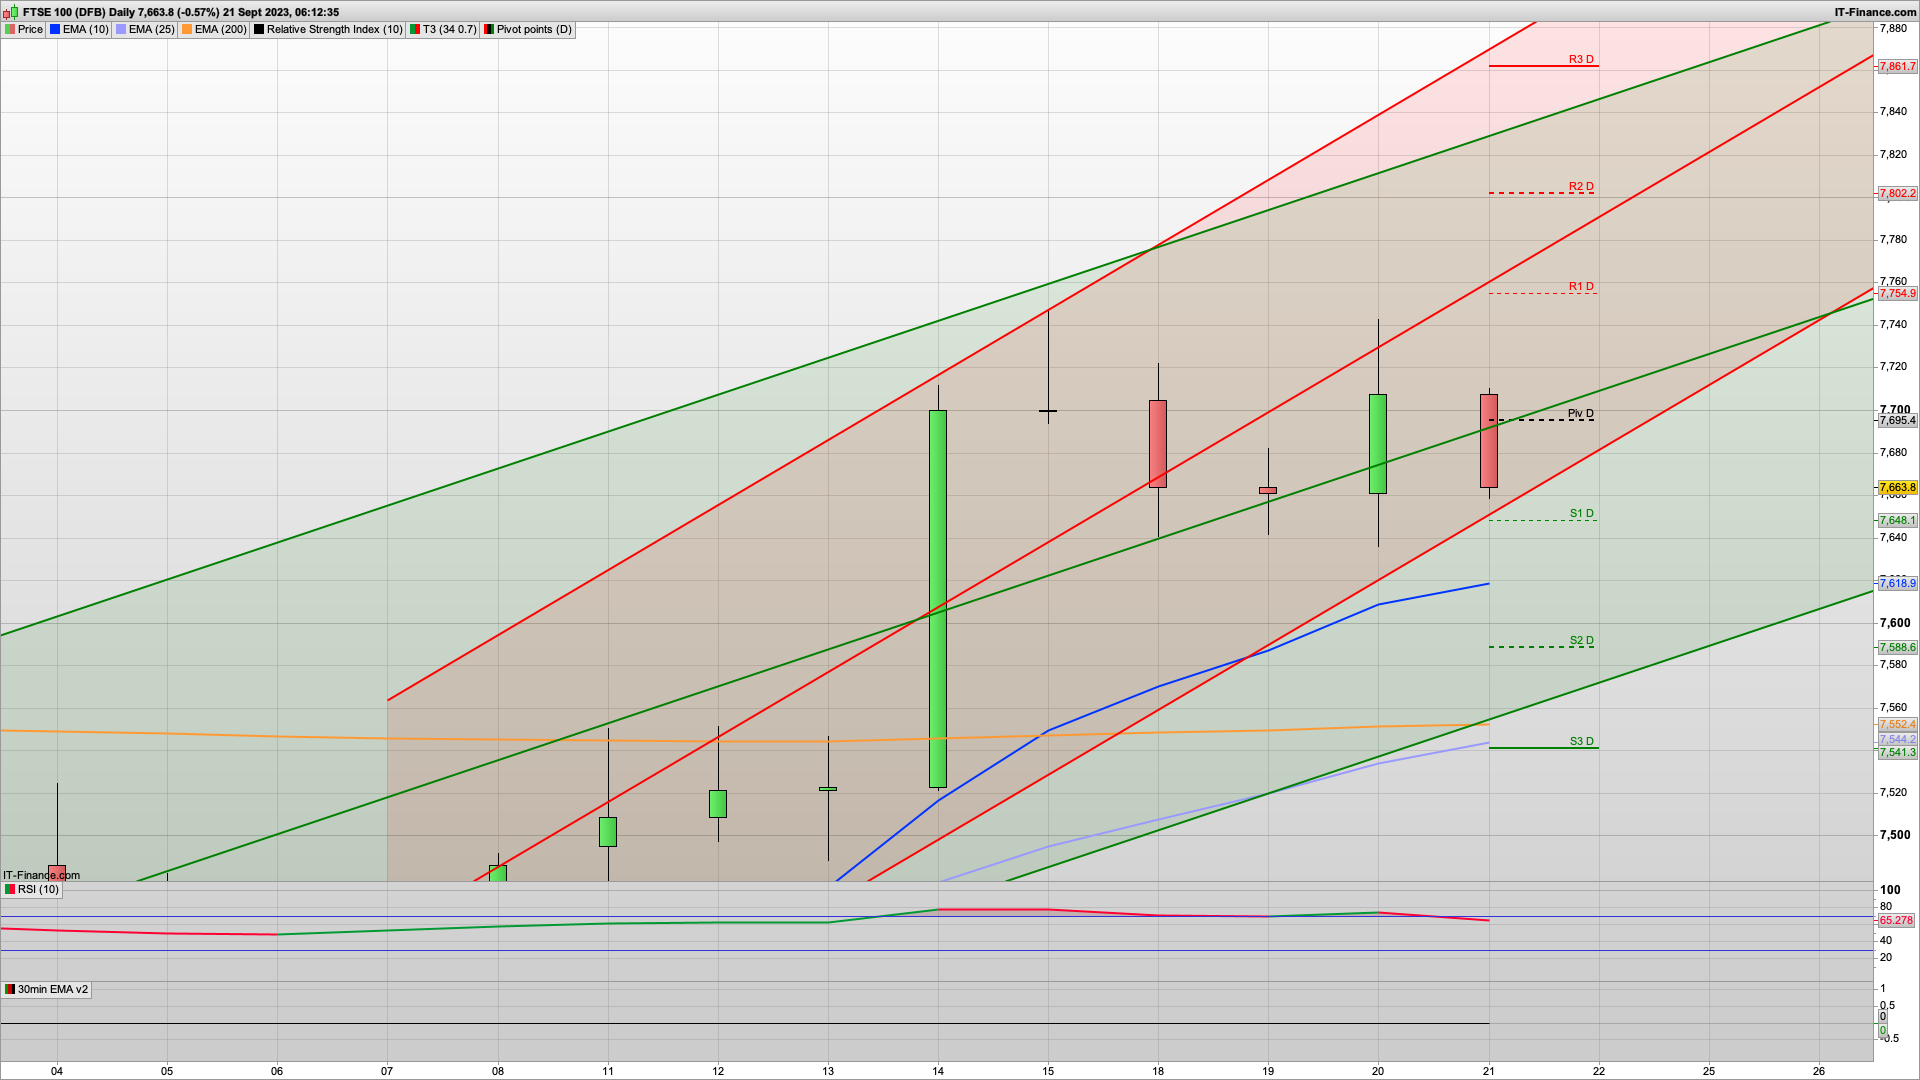
FTSE 100 technical analysis for today, 21st September 2023
Todays big event is the BoE at midday and the question is will they or won't they raise the rate another 25bps. The Fed held steady this month and we had a surprise fall in inflation for August despite the rising fuel prices which could force the BoE to hold steady and let the recent rate rises (which have been pretty aggressive as they left it too late to start raising) filter through into the economy. On the other hand, if they put it up then there is more scope to drop it down next year.... and they are in a rush to get inflation down to 2/3% to make Rishi look good.
Anyway, that news is out at 12:00 and we will get some movement around then. The S&P500 didn't like the Fed keeping their rates on hold, with an aggressive sell off from just shy of the 4464 short level. We may well see the FTSE100 do the same and stall around the 7710 level today. The 2h chart has 7710 as the Hull MA resistance, and based on that seasonality chart I am still thinking that we will get a drop down towards the 7550 level during September to test the daily 25ema and then set up a rally in October. Don't forget the rise and dip pattern for September on the seasonal chart here
Initial support is at the S1 and key fib level today at 7648 so we may well see a climb off this to start with, towards that 7710 level. 7650 is also the bottom of the 10d Raff hence thinking an early bounce off this may well play out.
Below that then the daily support level at 7606 is next in play and I would expect a bounce here, with that 7550 level below that though I am not expecting it to get that low today. More like next week for that....
Resistance wise, then the 7695 daily pivot, but a possible overshoot of that which tallies with a test of the 7710 30m coral and 2h Hull MA levels which may well hold today and a drop down from there.
If the bulls break above 7720 then 7754 is R1 and would be the next level that I would contemplate a short.
Looks like a rise and dip day across the board and watching the 7710 FTSE100, 4420 S&P500 and 15730 Dax 40 levels as the main resistance levels to watch for.
Good luck today.
Interested in how to start trading the FTSE 100? Frequently Asked Questions on Spread betting - Read more here
Recommended Broker for FTSE 100 trading and how to start trading using support and resistance

IC Markets - offers market leading pricing and trading conditions by providing clients with True ECN Connectivity; this allows you to trade on institutional grade liquidity from the world’s leading investment banks, hedge funds and dark pool liquidity execution venues. Highly recommended!
Membership, Trading Tips, Support and Resistance Levels with Live Trading
If you would like more detailed analysis for FTSE 100, DAX, Gold and S&P, including the trades that I am looking to take myself, then please join my active members community.
What you get
- Daily Analysis pre market open (sent around 7am each day) for FTSE 100, DAX40, Gold and S&P 500.
- Daily email pre market includes my trading plan for the day including ORDER levels, with stops and targets/limits
- Telegram live trading room and group membership for discussion and realtime trade updates
BoE keep Bank Rate UNCHANGED at 5.25%