
Technical analysis for 20th May 2026
FTSE 100
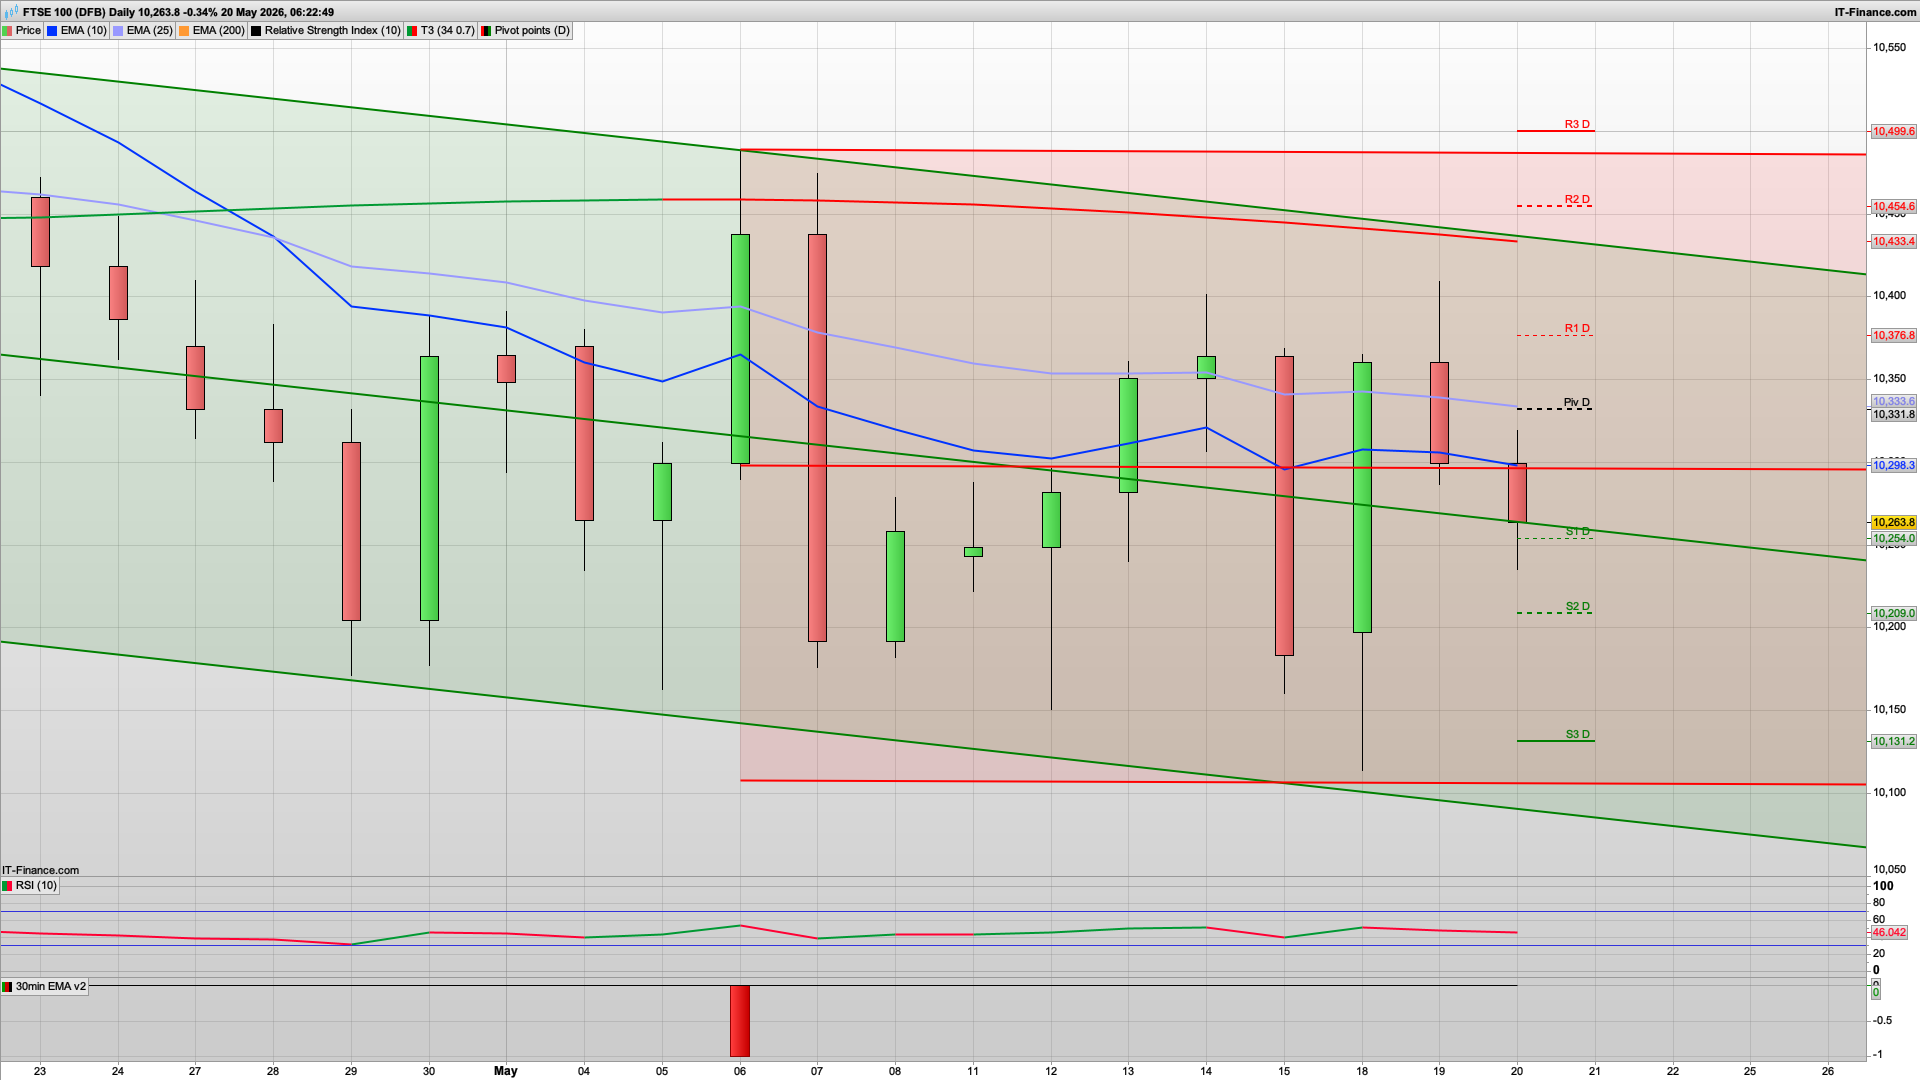
- Bias: Slight bearish / weak
- Rejected again near EMA and pivot
- Still trapped in broader downward channel
- Relative weakness vs US markets continues
- Key levels
- Resistance: 10,376 → 10,433 → 10,454
- Support: 10,254 → 10,209 → 10,131
- Trading view
- Sell rallies preferred unless price reclaims 10,330+
- Below 10,250 opens downside continuation
- FTSE remains choppy and lagging
- FTSE currently weakest equity index here.
DAX40
- Bias: Neutral → slight bullish recovery
- Market holding above the EMA cluster again
- Small indecision candle after yesterday’s recovery
- Structure improving, but still below major resistance channel
- Key levels
- Resistance: 24,618 → 24,906 → 25,117
- Support: 24,118 → 23,907 → 23,736
- Trading view
- Buy dips while above 24,150
- Break above 24,400/24,450 strengthens bullish continuation
- Failure below 24,100 would quickly turn bearish again
- DAX looks stabilising rather than trending aggressively.
NASDAQ
- Bias: Neutral-bullish
- Selling pressure easing after last week’s correction
- Price sitting directly on rising channel support + EMA
- Strong support zone around 28,750–28,800
- Key levels
- Resistance: 29,033 → 29,266 → 29,500
- Support: 28,567 → 28,333 → 28,100
- Trading view
- Slight preference for upside continuation
- Bulls need reclaim above 29,000 for momentum
- Holding above 28,750 keeps structure constructive
- NASDAQ still strongest overall index despite consolidation.
S&P 500
- Bias: Neutral with bullish undertone
- Market testing rising trend support
- EMA acting as dynamic support
- Momentum cooling but trend not broken
- Key levels
- Resistance: 7,392 → 7,440 → 7,470
- Support: 7,315 → 7,285 → 7,243
- Trading view
- Likely range-to-up trade today
- Buy support reactions near EMA/trendline
- A clean break under 7,315 weakens bullish structure
- S&P still healthier than European indices.
GOLD
- Bias: Bearish
- Clear lower highs and lower lows
- Trading beneath both EMAs and descending channel resistance
- Momentum still strongly favouring sellers
- Key levels
- Resistance: 4,560 → 4,637 → 4,685
- Support: 4,436 → 4,388 → 4,311
- Trading view
- Continue selling rallies
- 4,500 area remains key short-term battleground
- Below 4,436 could accelerate downside
- Gold remains under persistent pressure while equities stabilise.
Best Opportunities Today
- Best Long Candidates
- NASDAQ support bounces
- S&P EMA pullbacks
- DAX above 24,400 breakout
- Best Short Candidates
- Gold rallies
- FTSE failed rebounds
Market Tone Today
- Current charts suggest:
- US markets are consolidating after strong upside runs
- Europe still lagging and weaker
- Defensive flow into gold continues unwinding
- Overall environment remains cautiously risk-on, but momentum is slower than earlier in the week.
The bears appeared just shy of the 10420 resistance yesterday and we have seen a sustained sell off since, culminating in an overnight low at the 10250 area. This has held so far so we may well once again see a rise and dip play out as the bulls attempt an initial recovery ahead of the Nvidia results today, and with UK CPI and PPI news just out too.
Inflation fell last month as the drop in the Ofgem price cap outweighed the energy shock from the Iran war. The consumer prices index (CPI) dropped to 2.8pc in April, according to the Office for National Statistics (ONS), after regulators reduced annual household energy bills by £117. Economists fear the fall in inflation is a false dawn before a surge in prices later this year linked to the conflict in the Middle East. Petrol prices on Tuesday hit their highest level since the start of the war.
The Bank of England has forecast inflation could rise above 6pc in a worst case scenario if there is a long delay in reopening the Strait of Hormuz, where a fifth of global oil and gas exports usually pass.
If we do get an initial rise this morning then I am looking at the 10330 area as the key resistance zone with the 30m red coral and daily pivot here. The bulls will also be looking to break above the Hull MA on the 2h at the 10295 initially. If we move above the 10330 level then yesterday's high will be the next target if they can break R1 at 10376. 10330 is looking key though today!
Support wise, then the 10250 area as mentioned being the overnight low, along with the key fib and S1 here. A break of this though will likely see a slide down to the 10200 area and possibly 10181 to test the lower daily support. Look for a bounce here otherwise 10014 looms into view.
Interested in how to start trading the FTSE 100? Frequently Asked Questions on Spread betting
Recommended Broker for trading - MT4/5, web and mobile

IC Markets - offers market leading pricing and trading conditions by providing clients with True ECN Connectivity; this allows you to trade on institutional grade liquidity from the world’s leading investment banks, hedge funds and dark pool liquidity execution venues. Highly recommended!
Join my Membership for Trading Tips, Support and Resistance Levels with Live Trading
If you would like more detailed analysis for FTSE 100, DAX40, Gold and the S&P500, including the trades that I am looking to take myself, then please join my active members community.
Keep up to date with new website posts, free sign up below
