
Technical analysis for 19th May 2026
FTSE 100
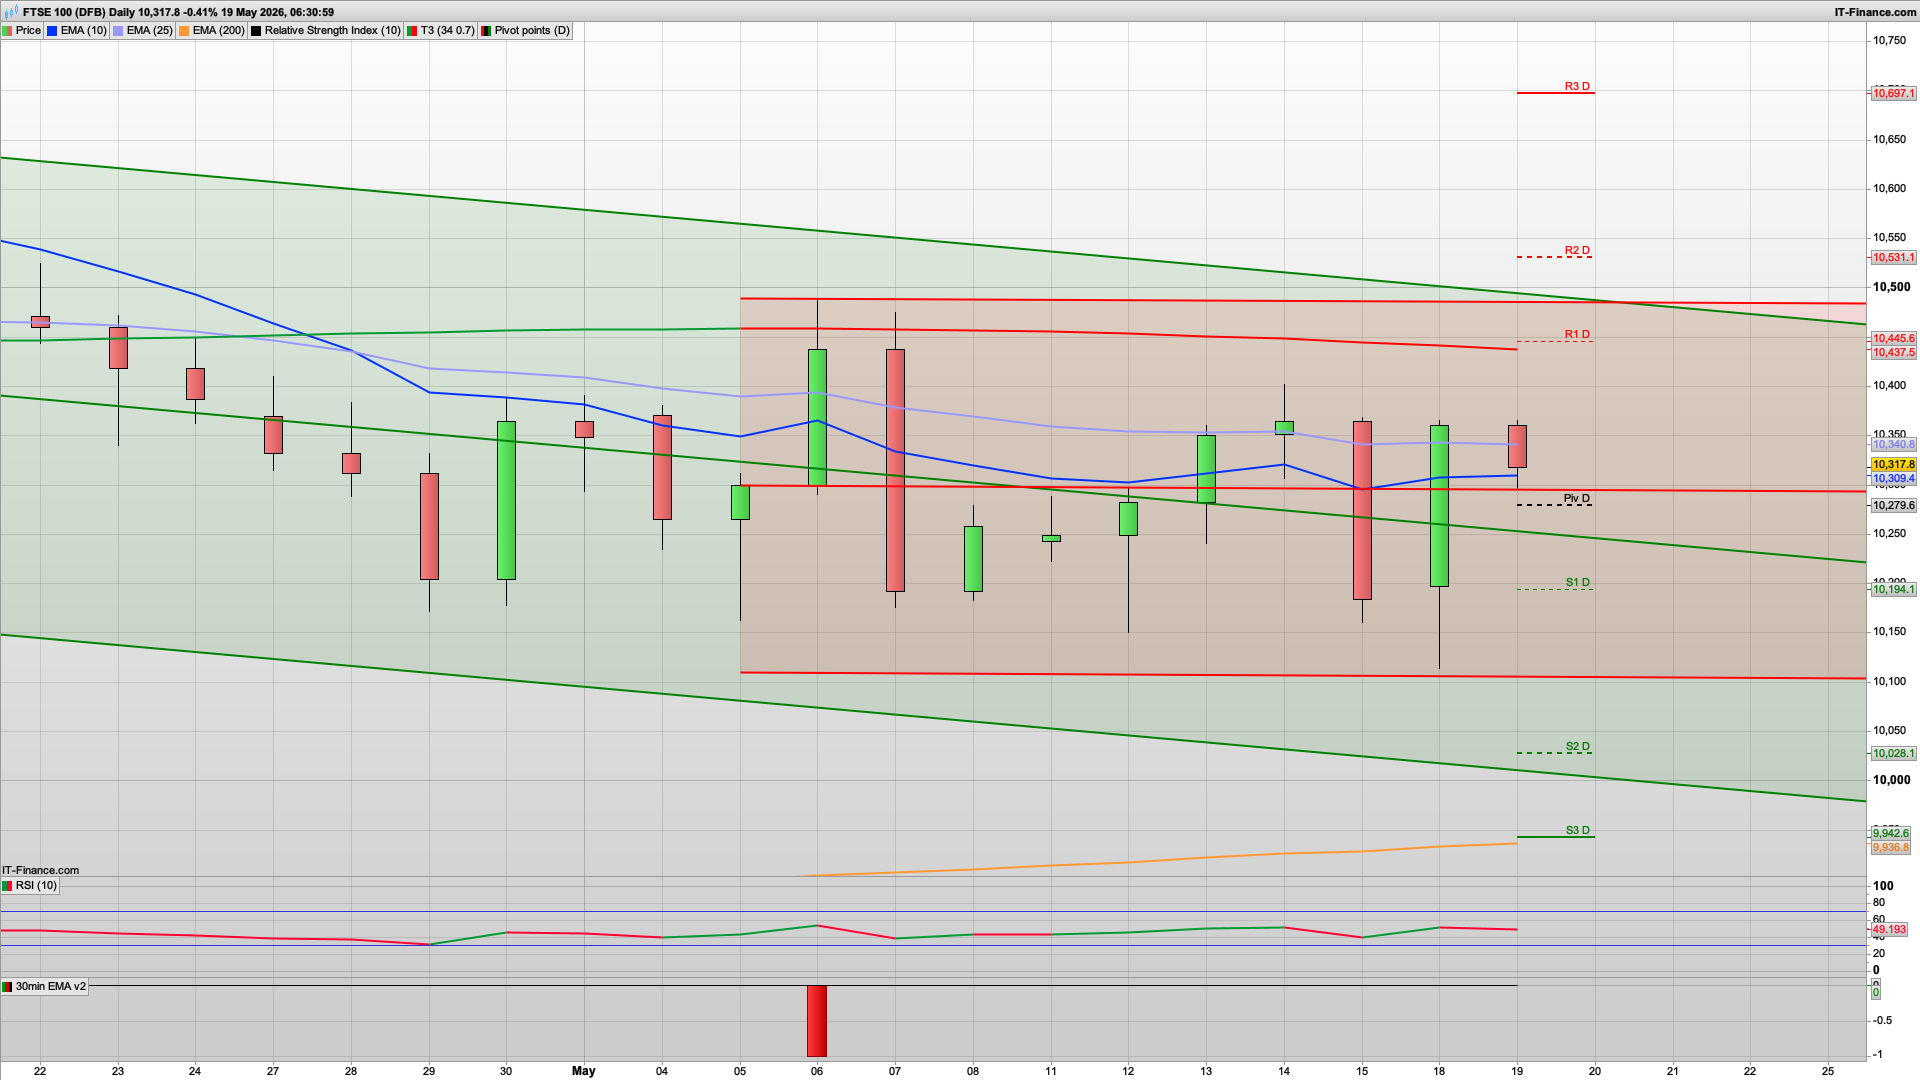
- Bias: Neutral / range-bound
- Market recovering from prior weakness
- Trading around pivot and moving averages
- No strong directional conviction yet
- Key levels
- Resistance: 10,445 → 10,531 → 10,697
- Support: 10,279 → 10,194 → 10,028
- Trading view
- Likely rotational/choppy trade today
- Needs breakout above 10,350–10,400 for bullish continuation
- Below 10,250 turns tone bearish again
- FTSE weaker than US indices but no longer aggressively bearish.
DAX40
- Bias: Neutral to slightly bullish
- Strong recovery candle yesterday after the selloff
- Price reclaimed EMA support and is holding above the pivot region
- However, market is still trapped inside a broader consolidation channel
- Key levels
- Resistance: 24,698 → 24,975 → 25,200
- Support: 24,166 → 23,889 → 23,710
- Trading view
- Buy dips while above 24,150
- A break above 24,450 would likely trigger continuation higher
- Failure back below pivot shifts bias bearish again
- DAX has improved materially versus yesterday.
NASDAQ
- Bias: Bullish recovery
- Holding the rising channel structure
- Reclaiming support after Friday’s selloff
- Price stabilising above the rising EMA
- Key levels
- Resistance: 29,237 → 29,581 → 29,842
- Support: 28,835 → 28,632 → 28,371
- Trading view
- Prefer buying dips
- Above 28,800 keeps upside structure intact
- 29,200 breakout could squeeze higher quickly
- NASDAQ remains the strongest equity index overall.
S&P 500
- Bias: Mild bullish
- Strong trend structure still intact
- Friday’s sell candle looks corrective rather than reversal
- Market defending EMA support and lower trend channel
- Key levels
- Resistance: 7,432 → 7,472 → 7,512
- Support: 7,351 → 7,311 → 7,271
- Trading view
- Bias favours continuation higher
- Buy pullbacks into EMA/pivot support
- A hold above 7,350 keeps bulls in control
- S&P structure still healthy despite recent volatility.
GOLD
- Bias: Bearish
- Downtrend remains intact
- Trading below both EMA structures and below descending resistance
- Momentum still favouring sellers
- Key levels
- Resistance: 4,546 → 4,622 → 4,650
- Support: 4,507 → 4,441 → 4,403
- Trading view
- Sell rallies remains preferred
- Any bounce into 4,600–4,620 likely attracts sellers
- Below 4,500 opens further downside extension
- Gold still looks technically weak versus equities.
Best Setups Today
- Strongest Longs
- NASDAQ dips
- S&P pullbacks
- DAX if momentum confirms above resistance
- Best Short
- Gold rallies into resistance
Broader Market Read
- Compared with yesterday:
- US indices are stabilising and regaining bullish structure
- European indices are lagging but improving
- Gold remains under pressure as risk appetite returns
- Current environment suggests:
- risk-on rotation back into equities
- tech leadership returning
- defensive assets weakening.
A decent bull Monday in the end yesterday which may roll through into today, at least for a little while. The bulls failed to get the 10375 level that we have as resistance so an early test of this looks likely, with a potential rise towards the 10420 level.
Unemployment in the UK has ticked up, wage growth declined and job vacancies declined also. The number of job vacancies dropped by 28,000 in the three months to April to a five-year low of 705,000. Average regular pay growth dropped to 3.4pc in the first three months of the year, according to the Office for National Statistics.
Inflation is forecast by the Bank of England to exceed 6pc later this year under its worst-case scenario, as the Middle East conflict pushes up prices of oil, gas and fertilisers used for food.
However, data on Wednesday is expected to show inflation rose at a slower pace in April due to the falling Ofgem energy price cap.
A rise and dip may well therefore play out today, if the bulls fail to crack the 10420 level and a drop back towards the 10300 level could kick in for a bear Tuesday later. The US markets are slowly looking more bullish but the bulls will need to defend the 7350 level on the S&P500 - which if they do may well help the FTSE100.
If the bears break the daily pivot level then it would be worth shorting for a drop down toward the 10194 S1 level, with a potential drop as far as yesterdays low at 10115. That feels a bit too pessimistic though given we are currently at 10337 so I am more inclined to go with the pivot holding.
Good luck today.
Interested in how to start trading the FTSE 100? Frequently Asked Questions on Spread betting
Recommended Broker for trading - MT4/5, web and mobile

IC Markets - offers market leading pricing and trading conditions by providing clients with True ECN Connectivity; this allows you to trade on institutional grade liquidity from the world’s leading investment banks, hedge funds and dark pool liquidity execution venues. Highly recommended!
Join my Membership for Trading Tips, Support and Resistance Levels with Live Trading
If you would like more detailed analysis for FTSE 100, DAX40, Gold and the S&P500, including the trades that I am looking to take myself, then please join my active members community.
Keep up to date with new website posts, free sign up below
