
Technical analysis for 17th February 2026
FTSE100 Bias
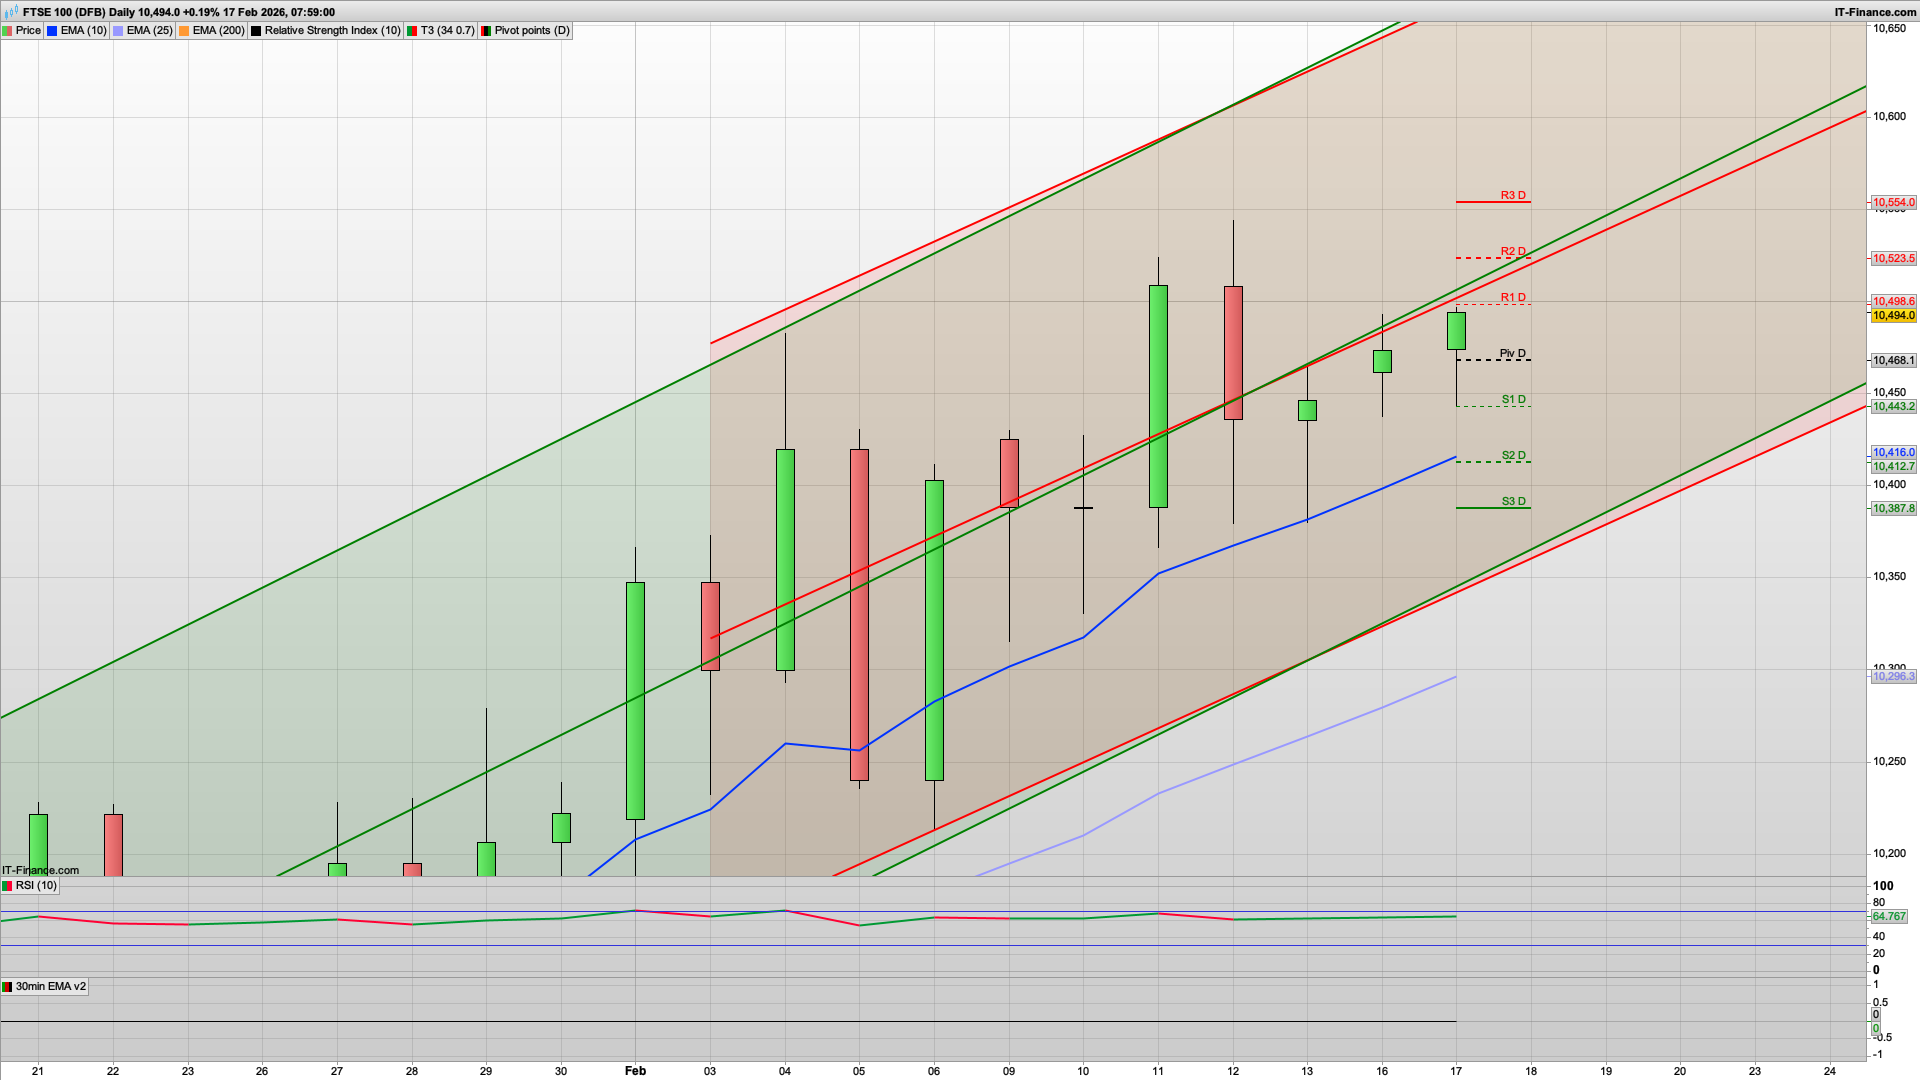
- Bias: Bullish (trend intact – buy pullbacks)
- Still respecting rising channel
- Holding above pivot
- EMAs stacked and rising
- Higher-low structure intact
- Bullish continuation above: 10,468 – 10,494 support zone
- Bearish only if: sustained break below 10,443 / S1
- FTSE remains the relative strength leader
S&P500 Bias
- Bias: Bearish
- Strong impulsive sell candle
- Price below pivot + below falling EMA cluster
- Channel resistance holding
- RSI under 50 with clear momentum shift
- Bullish only if: reclaim 6,825 – 6,895 zone
- This is currently the weakest of the three indices
DAX40 Bias
- Bias: Bearish → while below 24,985 (Pivot)
- Price rejected the upper channel and closed back under the pivot
- 10 & 25 EMA rolling over → momentum turning down
- RSI slipping below 50 = loss of bullish pressure
- Lower high printed vs prior push
- Bullish only if: clean reclaim and hold above 24,985
- Structure = range high rejection → downside rotation risk
Higher-timeframe context (Daily)
- Price remains inside the rising channel → primary trend still bullish.
- It's trading above the 10 & 25 EMA and they’re stacked bullish → dip-buying conditions.
- Current candle is pushing back towards R1 area (~10,498–10,523 zone).
- RSI ~ mid-60s → room for upside, not overbought.
- Bias from the daily: Buy dips unless the channel support breaks.
Intraday structure (30-min)
- Strong impulsive move through the daily pivot (≈10,468) → momentum shift bullish.
- Clean EMA alignment with price holding above them.
- Currently sitting just under R1, so first test will decide continuation vs pullback.
Expecting a rise and dip to play out today as mentioned earlier, with the 10523 level looking like initial resistance. The US returns from their day off yesterday which usually sees some buying kick in at the start of their session. That could help the FTSE100 bulls later for a push up towards the 10554 R3 level and also the recent high - whereupon we may well see the bears have another attempt to drive it down.
Support is at the daily pivot at the 10468 level and this is key - a break of this is likely to lead down to the 10442 200ema level, and possibly down to the S2 level at 10412. However, I am more inclined to go with the bulls attempting to hold above the daily pivot today. We have broken though the 2h Hull MA as well at the 10480 level already which shows the the bulls have the upper hand currently.
UK jobs data out earlier showed an uptick in unemployment, not surprising really, and with the economy continuing to weaken we may well see interest rates adjusted downwards again soon, despite inflation still running above the 2% target.
Good luck today.
Interested in how to start trading the FTSE 100? Frequently Asked Questions on Spread betting
Recommended Broker for trading - MT4/5, web and mobile

IC Markets - offers market leading pricing and trading conditions by providing clients with True ECN Connectivity; this allows you to trade on institutional grade liquidity from the world’s leading investment banks, hedge funds and dark pool liquidity execution venues. Highly recommended!
Join my Membership for Trading Tips, Support and Resistance Levels with Live Trading
If you would like more detailed analysis for FTSE 100, DAX40, Gold and the S&P500, including the trades that I am looking to take myself, then please join my active members community.
Keep up to date with new website posts, free sign up below
