
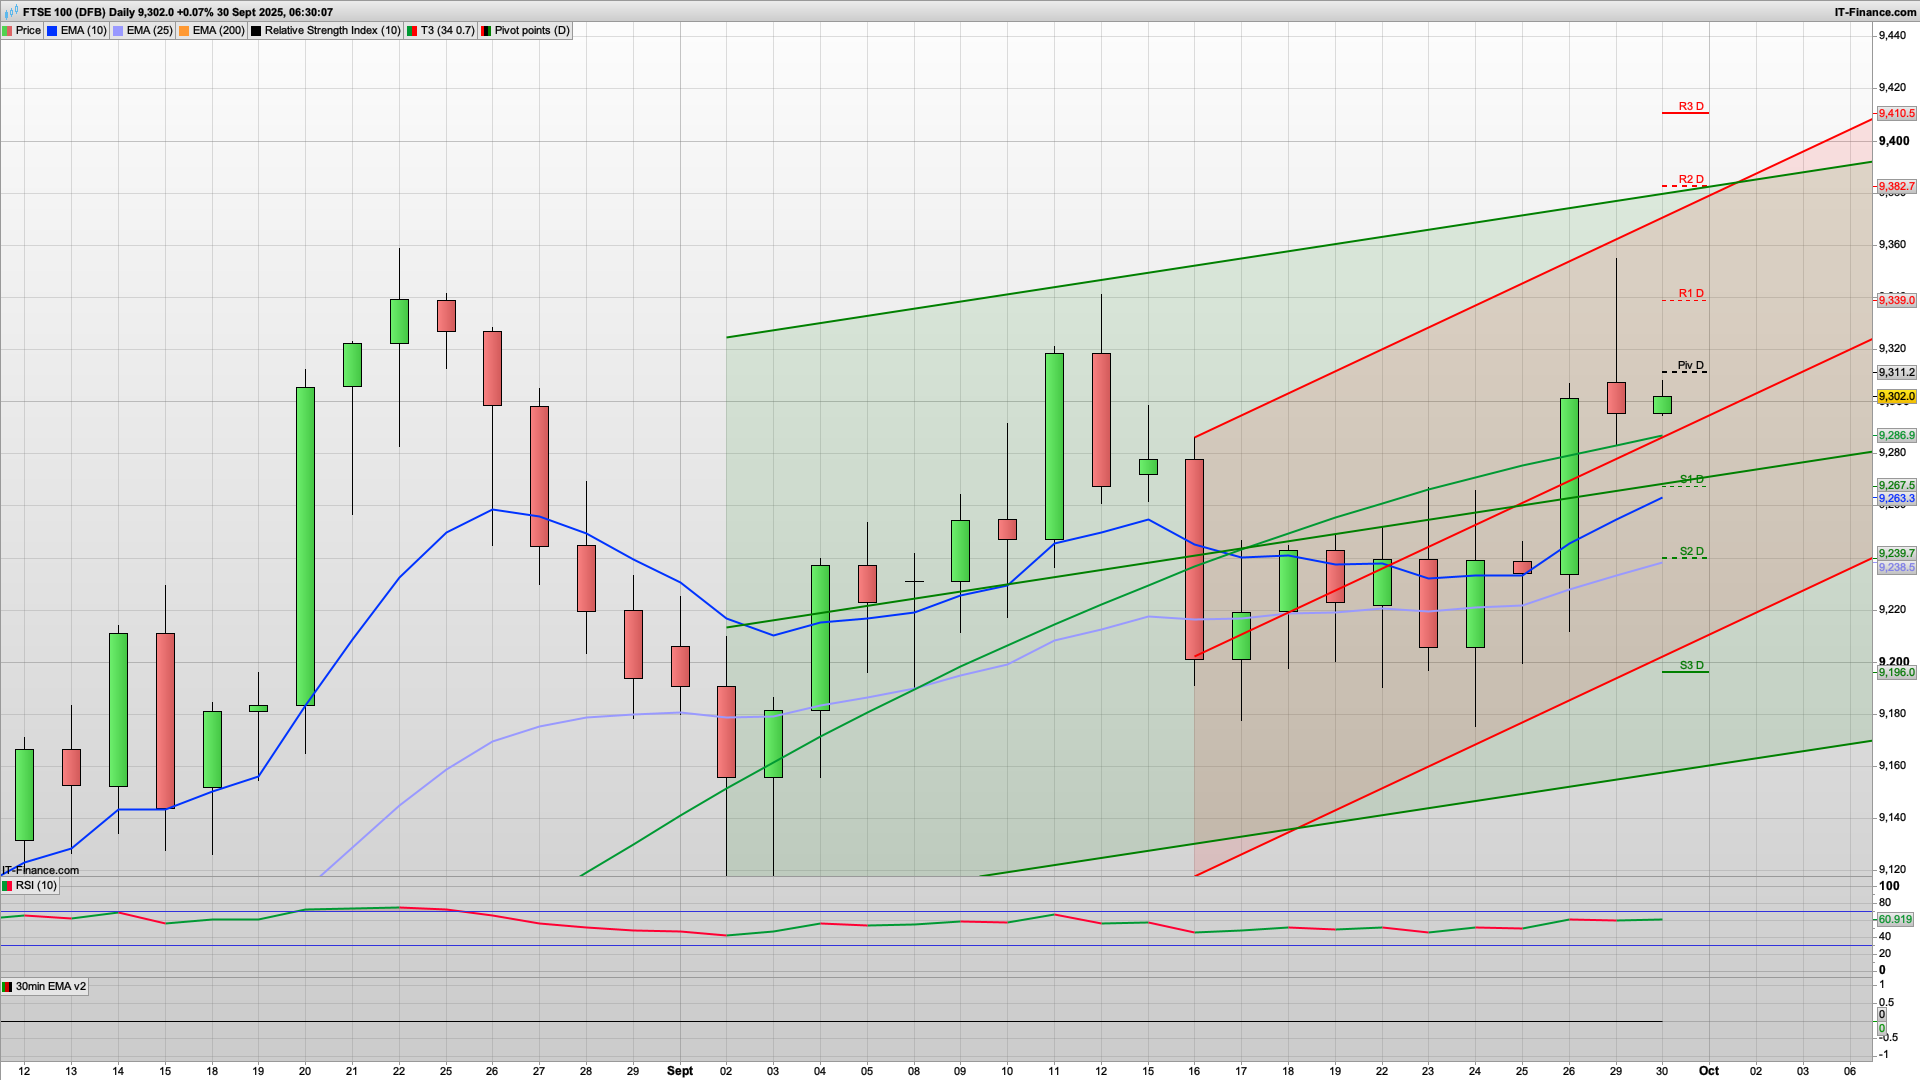
Technical analysis for FTSE 100 for 30th September 2025
A decent reaction at the 9351 resistance level yesterday for our short and the bears managed to drop it down to test the 9300 area, which has held so far. The UK GDP figures have just been released with a slight beat at 1.4% which may well help the bulls initially, though a bear Tuesday is looking likely today. The bears will be keen to break below the 9300 level as that would open up a test of the 9270 area where we have the S1 and 30m 200ema as support to start with.
Below that then they will be aiming for the 9240 area where we have the key fib and also S2, and we may well see this hold. The S&P500 closed its gap yesterday at 6650 and the 2h chart remains bullish so the bulls will be keen to keep that momentum going and continue to push for the 6700 area. That in turn may well help the FTSE100 bulls defend any dips. On the longer time frames the FTSE100 is still in buy the dip mode.
Though weakened, the 2h chart is bullish, with the green coral lending support at 9265 currently.
Back to the 30m chart and the red coral is sitting at the same level as the daily pivot at the 9311 level so we may well see this act as early resistance. Above this then a retest of the 9350 is likely, and the more that is tested the more likely it is to break, which would then open up a rise towards the 9380 area where we have R2 and also the top of both the daily Raff channels.
That might be more likely tomorrow though, as I think the bears will try hard today. Bear Tuesday and all......
Below the 9240 level then 9196 is S3 and aligns with the lower daily support at 9203, though I don't think we will see it get that low today.
For the DAX40, the daily pivot and red 30m coral are initial resistance at 23767 and ultimately we may see a slide down to the 23593 key fib level, but prior that and likely to get a reaction is the 30m 200ema at 23690 so look for a potential bounce here. Above the daily pivot then 23800 round number is next up with the fib at 23914 above that. The 2h chart remains bullish and has the green coral at 23680 to lend further support here. Ergo a long here is worth a go. I am still running a portion of the long from 23685 and continue to trail the stop on that.
Meanwhile, the S&P500 looks the most optimistic of the lot and has good support at the 6635 level with both the coral and Hull MA here on the 2h chart. As such should it drop to this area then look for a long here. Initial resistance is 6670 from the red 30m coral, and then R1 at 6681 above that. If the bulls do manage to push it up towards the 6700 level then look for a reaction at the 6704 key fib, which is just above 6701 R2. Lower support meanwhile is at S2 6623.
Good luck today.
Interested in how to start trading the FTSE 100? Frequently Asked Questions on Spread betting
Recommended Broker for trading - MT4/5, web and mobile

IC Markets - offers market leading pricing and trading conditions by providing clients with True ECN Connectivity; this allows you to trade on institutional grade liquidity from the world’s leading investment banks, hedge funds and dark pool liquidity execution venues. Highly recommended!
Membership, Trading Tips, Support and Resistance Levels with Live Trading
If you would like more detailed analysis for FTSE 100, DAX40, Gold and the S&P500, including the trades that I am looking to take myself, then please join my active members community.
Keep up to date with new website posts, free sign up below
