
Technical analysis for 28th October 2025
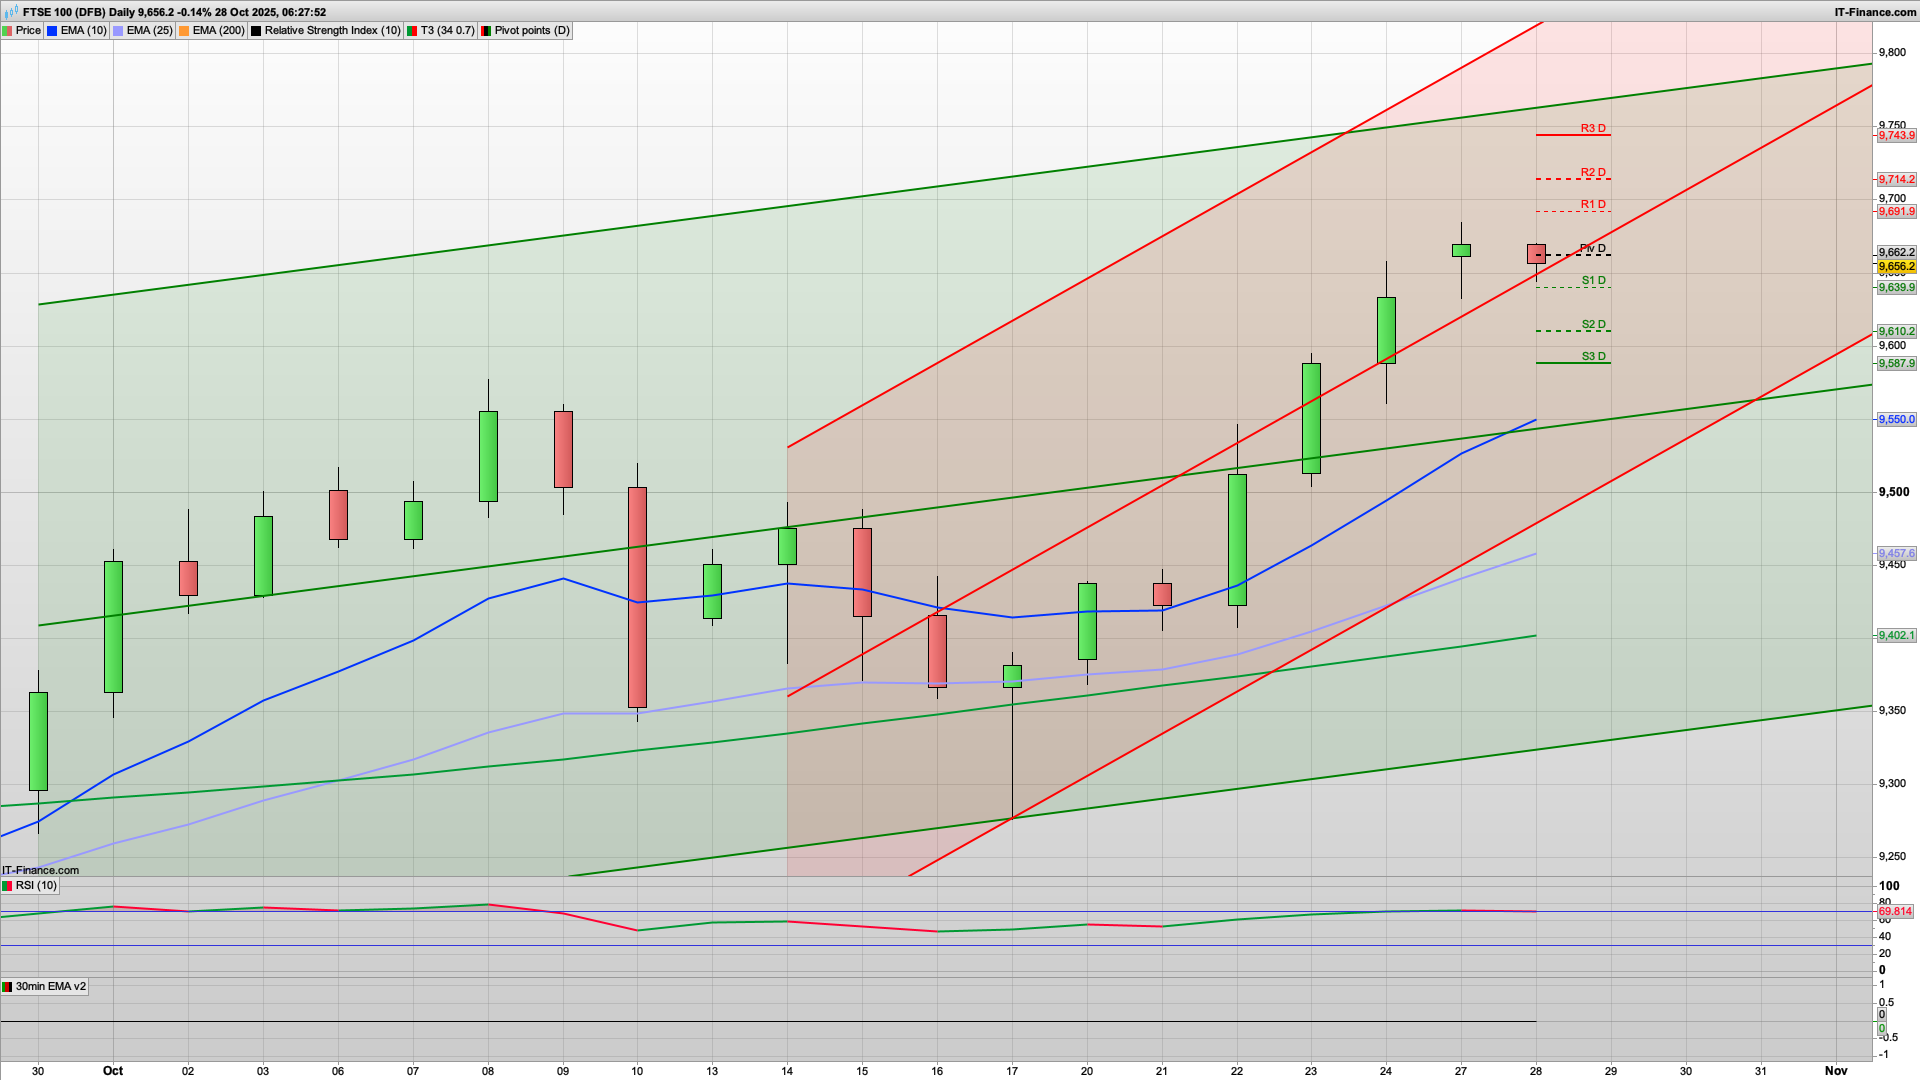
A day of consolidation yesterday saw the FTSE100 hover between 9675 and 9635. We may well see a bear Tuesday today and I am looking for sells around the R1 level a the 9691 for today, for a run down towards the daily coral line at 9620. The bulls will of course still be looking to get the price above the 9700 level, and we still have daily resistance in play at 9750 above that.
FTSE100 Bias Summary
- Bias: Neutral to mildly bearish (pause within uptrend).
- Short-term resistance: 9,670–9,700.
- Support zone: 9,610–9,640.
- Trade focus: Wait for rejection near R1 for a short scalp, or breakout confirmation above R1 for a momentum long.
- Risk control: Avoid chasing highs — the market looks due for a brief breather before next leg higher.
The daily Raff channels continue to head upwards as well, but following yesterdays consolidation we have a bearish Hull MA set up on the 2h chart, with resistance from that at 9690 - lining up nicely with R1 - hence thinking that could cap early proceedings this morning. If the bulls were to push on today, and break that then we also have R3 lining up at 9743 with that daily resistance so look for shorts here too. Feels like a "sell the rally" potentially today.
Support wise, if the 9640 S1 level breaks then a drop down to the 9620 as mentioned, and then below this we have strong support at the 9590 level with S3 and the 30m 200ema here - so a decent potential bounce point if it were to get that low. That feels a bit pessimistic but you never know.
Gold continues to slide having tested the 4350 area and having now broken the 4000 level the bears are firmly in control - we may well see the continued cycle of money out of that and into indices for the Santa Rally.
DAX40
Similar picture for the German market, with a potential rise towards the 24480 key fib this morning, and then possibly the bears appearing here for a run down to the 24250 level or lower. Initial resistance is at the daily pivot so the bulls will be looking to break this 24305 level initially, and we have held the 30m 200ema overnight at 24250 support so they have a bit of a springboard initially. Lower support is at 24154 where we have the lower key fibonacci level. Rise and dip as a bear Tuesday kicks in later looks likely.
S&P500
Also defending the daily pivot at 6866 to start with so again a rise and dip may well play out, with a test of the 6910 area where we have both R2 and the key fib level. The 2h chart remains bullish, with Hull MA support around. the 6850 level on that, which lines up with S1 nicely, so we may well see that hold today. If the bulls were to break 6913 then 6929 is R3 and the next shorting level/target for longs.
Good luck today.
Interested in how to start trading the FTSE 100? Frequently Asked Questions on Spread betting
Recommended Broker for trading - MT4/5, web and mobile

IC Markets - offers market leading pricing and trading conditions by providing clients with True ECN Connectivity; this allows you to trade on institutional grade liquidity from the world’s leading investment banks, hedge funds and dark pool liquidity execution venues. Highly recommended!
Membership, Trading Tips, Support and Resistance Levels with Live Trading
If you would like more detailed analysis for FTSE 100, DAX40, Gold and the S&P500, including the trades that I am looking to take myself, then please join my active members community.
Keep up to date with new website posts, free sign up below
