
Technical analysis for 4th November 2026
Global markets face another potentially volatile session as investors assess the emerging results of the US midterm elections, renewed geopolitical tensions in the Middle East and the latest developments in artificial intelligence.
Tuesday produced a sharp contrast between Europe and Wall Street. The FTSE 100 suffered a substantial decline following renewed US military strikes against Iran, while the S&P 500 and Nasdaq recovered as investors returned to selected technology shares.
Overnight, US equity futures have weakened, government bonds have attracted renewed buying interest and Gold has strengthened as investors consider the possibility of Democrats gaining control of Congress.
There is some encouragement from the technology sector, with stronger-than-expected results from AMD helping restore confidence in AI-related demand. However, political uncertainty and the unresolved US-Iran conflict remain significant risks.
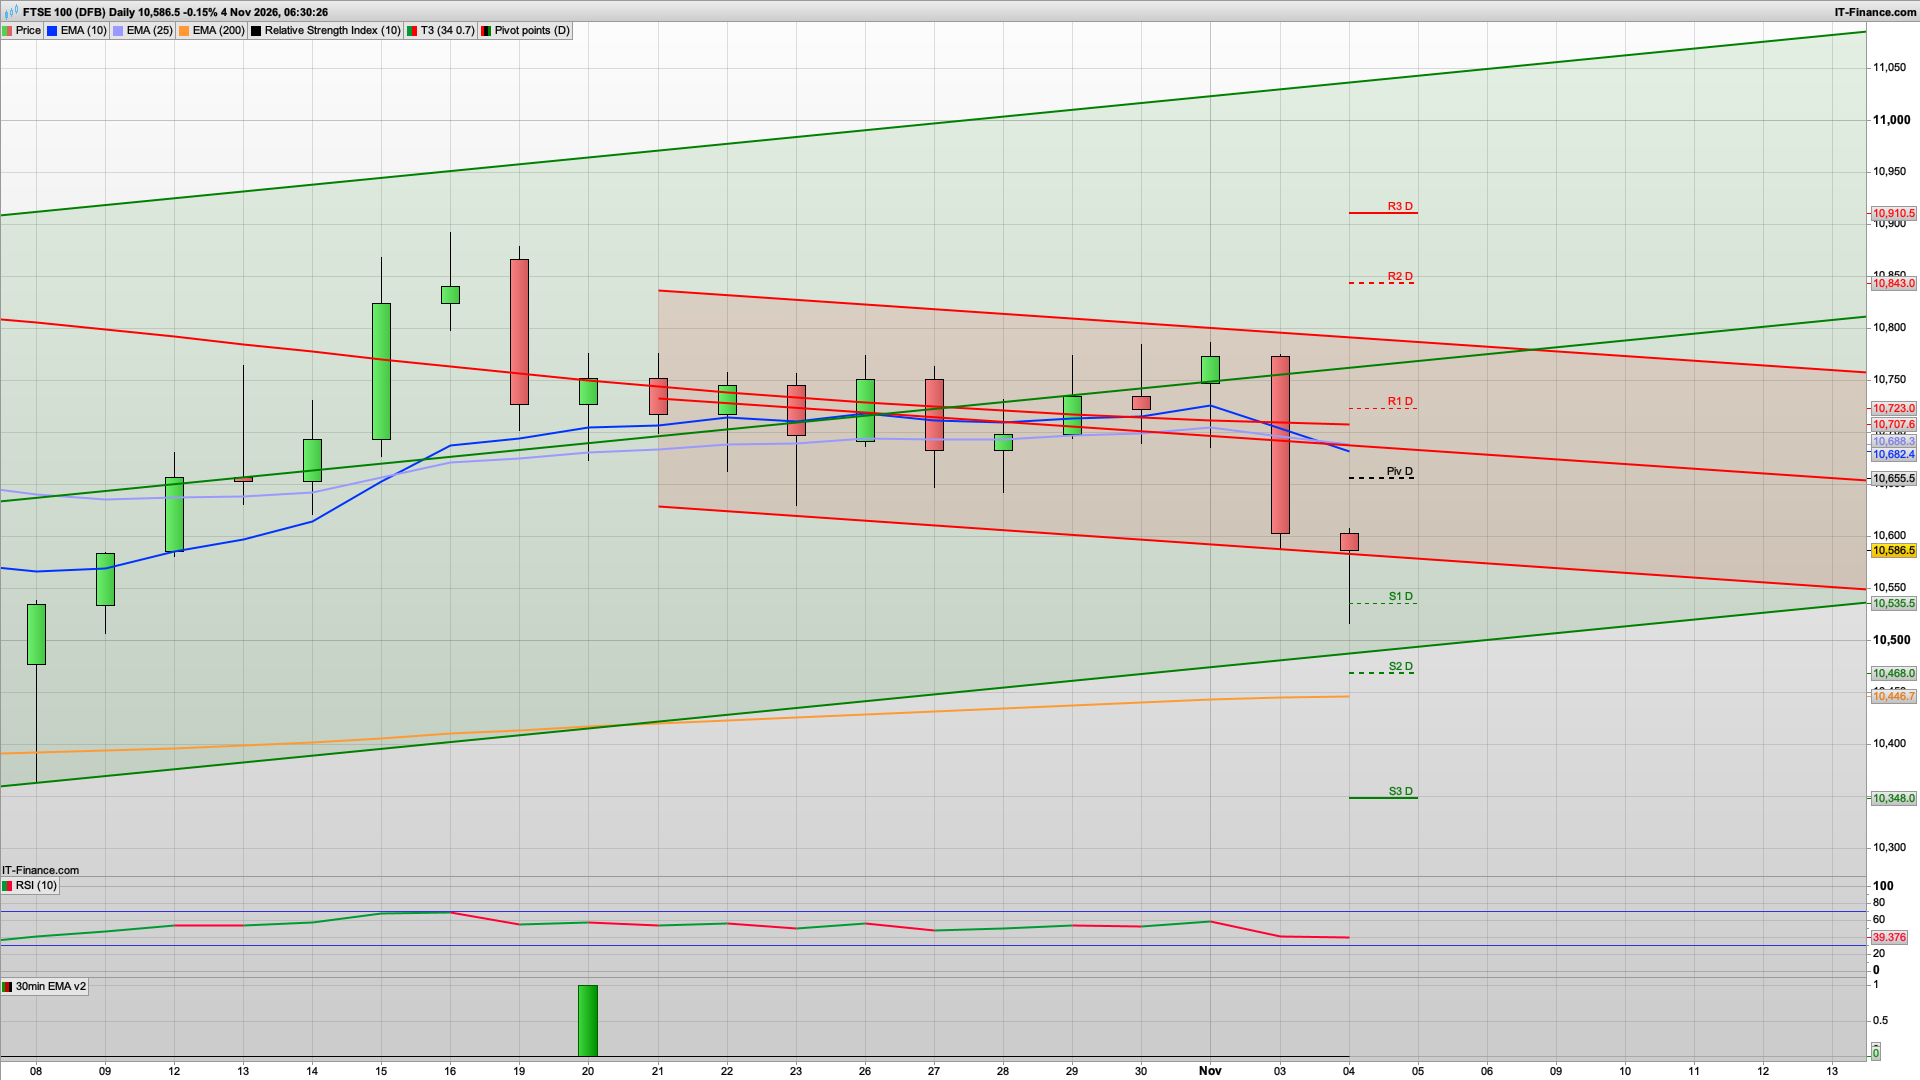
Yesterday's sharp sell-off has materially changed the technical picture. The FTSE has broken below its daily 10- and 25-period EMAs, daily RSI has fallen below 40, and the 30-minute chart shows a sustained sequence of lower highs and lower lows. There is a modest recovery underway from overnight lows around 10535-550, but this currently looks more like a corrective bounce within a bearish trend than the beginning of a sustained recovery.
My prediction today is for an initial recovery towards 10615-655, followed by renewed selling if resistance holds.
The most important battleground today is 10535 support versus 10655 resistance with the daily pivot here. 10675 is just above this with the 30m 200ema,
A sustained move above 10655 would weaken the immediate bearish outlook. A break below 10535 would increase the likelihood of another significant decline.
The daily RSI(10) has fallen to approximately 40, compared with 52 yesterday. That is a substantial deterioration in momentum and suggests sellers have taken control. The daily chart also shows a large bearish candle from Tuesday, followed by continued weakness overnight and the FTSE is trading beneath both short-term daily moving averages and below the descending resistance structure that has contained price since mid-October.
The 30-minute chart confirms the weakness, although the overnight bounce suggests some short-term selling exhaustion.
For more more analysis including other markets please join...
Interested in how to start trading the FTSE 100? Frequently Asked Questions on Spread betting
Recommended Broker for trading - MT4/5, web and mobile

IC - offers market leading pricing and trading conditions by providing clients with True ECN Connectivity; this allows you to trade on institutional grade liquidity from the world’s leading investment banks, hedge funds and dark pool liquidity execution venues. Highly recommended!
Join my Membership for Trading Tips, Support and Resistance Levels with Live Trading
If you would like more detailed analysis for FTSE 100, DAX40, Gold and the S&P500, including the trades that I am looking to take myself, then please join my active members community.
Keep up to date with new website posts, free sign up below