
Technical analysis for FTSE 100 for 1st September 2025
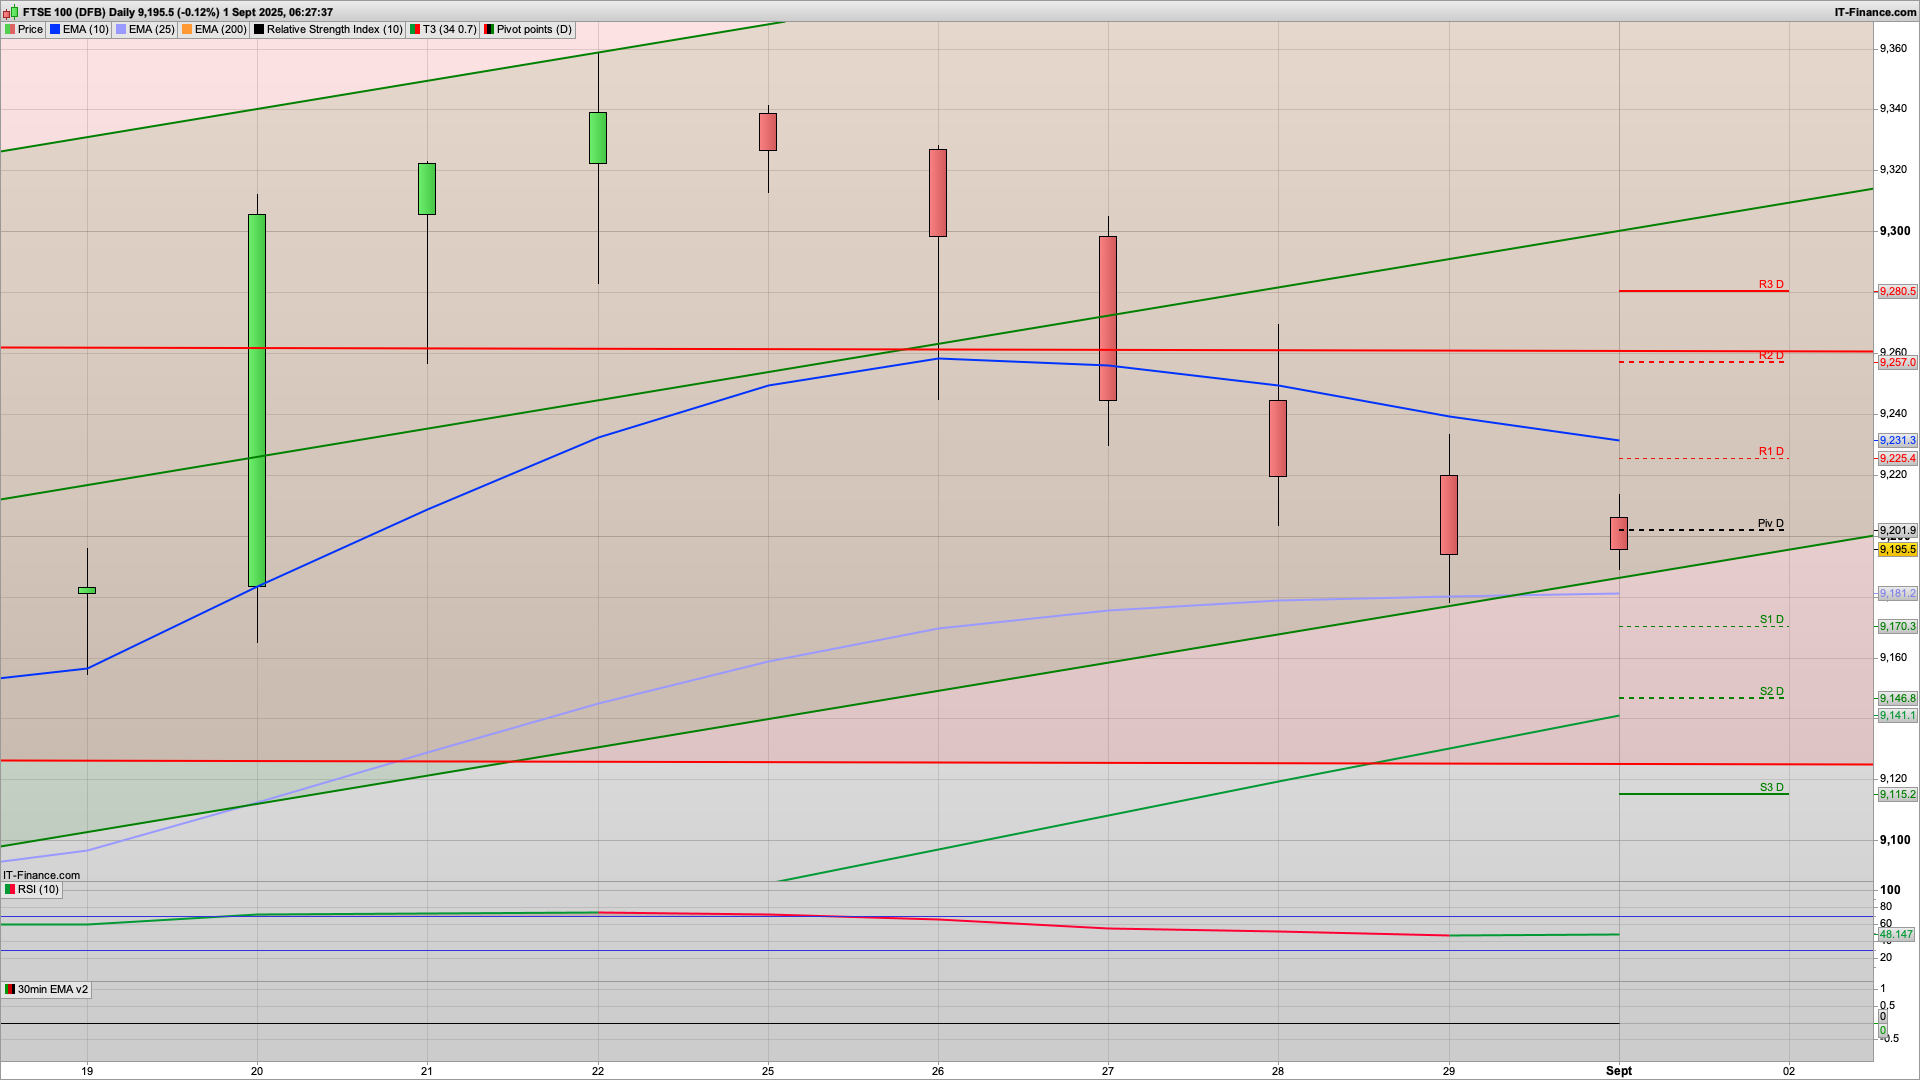
The US is closed today for a public holiday which may well lead to a more subdued FTSE100 session. That said we have a range in play with 9200 resistance and support looking decent at the 9150 level as there are a cluster of key levels here, namely the S2, key fib and the daily coral (green). As such I would like to see any dip down to this hold for a bounce back up and an attempt at a bull Monday. The general sentiment is erring to the bearish side though after last weeks decline but we are now emerging from the holiday period. September is also traditionally weaker though.
Initially the 9200 level is the daily pivot resistance and the bulls will be looking to nudge above this if possible to start with. That could then test the 9225 R1 and 30m 200ema levels and subsequently see the bears appear here for a dip and rise to play out today. The 2h coral is now also red and has resistance a bit higher at the 9230 level. That lends more weight to this area for a drop off from here.
Should the bulls push on, and with the US closed they are more likely to be a bit more cautious, then the 9263 level is the next key daily level of note so look for a short there. I am not really thinking it will get that high though and the 9220-9230 are is more likely to cap proceedings.
Support wise, the 9150 area as mentioned is key today. A break of this will likely see a slide down to the 9126 level and a test of the bottom of the 10d Raff channel, as well as being just above S3 at 9115. Again, this may be a bit far for today and a hold of the 9150 area is more likely.
The S&P500 meanwhile is likely to be a bit more subdued due to being closed though has decent support at the 6436 S1 level, along with the key fib at 6429 so I am looking at this level holding. The bulls will need to break the daily pivot at 6469 to enable further upside towards the 6500 level.
For the DAX40 then again a dip and rise would fit the charts well and whilst short term bearish we could dip down to the 23850 area where we have S1 and the key fib. As per the other markets, I would like to see this dip and rise play out and this level hold, for a rise to then manage as far as 24000. The longer term Dax chart is bearish with 10d Raff channels declining and a bearish MA set up - the 25ema resistance at 24140 currently.
Good luck today.
Interested in how to start trading the FTSE 100? Frequently Asked Questions on Spread betting
Recommended Broker for trading - MT4/5, web and mobile

IC Markets - offers market leading pricing and trading conditions by providing clients with True ECN Connectivity; this allows you to trade on institutional grade liquidity from the world’s leading investment banks, hedge funds and dark pool liquidity execution venues. Highly recommended!
Membership, Trading Tips, Support and Resistance Levels with Live Trading
If you would like more detailed analysis for FTSE 100, DAX40, Gold and the S&P500, including the trades that I am looking to take myself, then please join my active members community.
Keep up to date with new website posts, free sign up below
