
Technical analysis for FTSE 100 for 18th July 2025
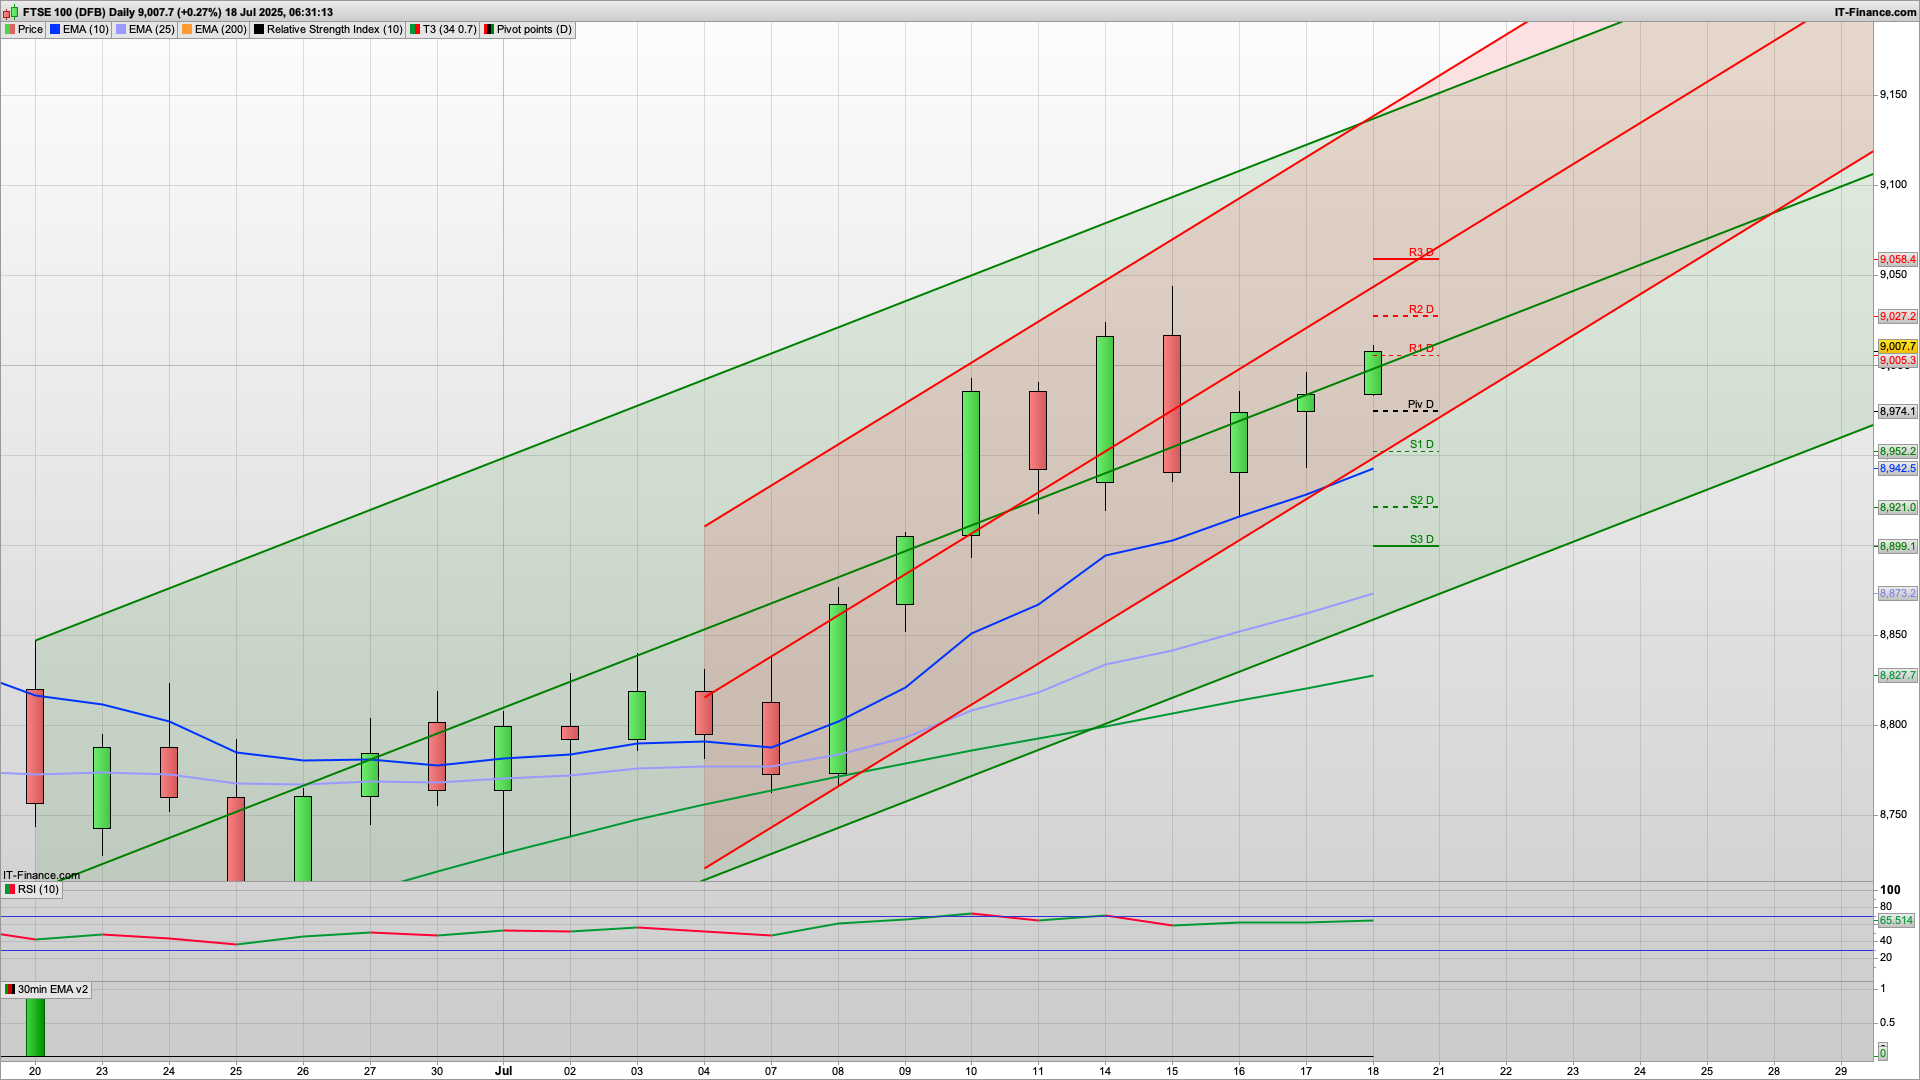
The bulls still remain in charge and will be looking to close the week out on a high and above the 9000 level ahead of the weekend. Initially we may well see a bit of a dip down to the daily pivot at the 8975 area before another push higher later on as the bulls will be keen to target the 9050 area where we have R3.
The charts are all looking bullish to start with and the Raff channels continue to head up, along with the Hull MA on the 2h lending support at the 8984 level initially. As there are also a cluster of supports around this area then it would be good to see this hold to end the week on a high.
Initial resistance is at 9005 with R1 here so may well as the initial drop point, but above this we have the 9035 key fib just above the 9027 R2. That's followed by the recent high level and daily resistance at 9050, with R3 at 9058. As such, this area may well cap proceedings initially, but above this then 9075 is the higher daily resistance level and worth a short if seen.
If the bears were to break below the 8975 level today though then a slide down to the 8950 level looks possible where we have S1 and the bottom of the 10d Raff channel. Should this happen then I would like to see this level hold to then get a decent recovery area ahead of the weekend.
There isn't any major UK news due today so a drift higher looks likely.
The S&P500 continues to rise and has now pushed past the 6300 level. Again a dip and rise looks possible on this with decent support at the 6285 area with the daily pivot here, and should coincide with the Hull MA on the 2h chart as well - thats currently lower but rising strongly. Below 6285 then 6266 is S1 and the 200ema on the 30min. Initial resistance is at 6323 which could see some profit taking before more buying later on, with 6342 R2 above that. Thats also just below the top of the 10d Raff channel so may well be the top for today.
Similar picture for the DAX40 with a dip and rise looking possible. Initial resistance is at the 24500 level where we have R1 and the key fib so a drop from here down to the pivot at 24328 may well play out. Above 24500 then 24589 R2 is next up. Below the daily pivot though and the bears will be aiming for the 24177 level which is key fib support, and also the Hull and Coral support zone on the 2h chart.
The Raff channels are still heading up across the board still so buying the dips is still preferred for the moment as the bullish momentum continues.
Good luck today and have a great weekend.
Interested in how to start trading the FTSE 100? Frequently Asked Questions on Spread betting
Recommended Broker for trading - MT4/5, web and mobile

IC Markets - offers market leading pricing and trading conditions by providing clients with True ECN Connectivity; this allows you to trade on institutional grade liquidity from the world’s leading investment banks, hedge funds and dark pool liquidity execution venues. Highly recommended!
Membership, Trading Tips, Support and Resistance Levels with Live Trading
If you would like more detailed analysis for FTSE 100, DAX40, Gold and the S&P500, including the trades that I am looking to take myself, then please join my active members community.
Keep up to date with new website posts, free sign up below
