
Technical analysis for 11th November 2026
Global financial markets begin Wednesday on a more cautious footing after yesterday's stronger-than-expected US inflation figures interrupted the recovery in equities.
The key development is that US inflation remains more persistent than investors had hoped. October's Consumer Price Index rose 0.4% month-on-month, compared with expectations of 0.3%, while core inflation increased 0.3% against forecasts of 0.2%.
The figures reinforced expectations that the Federal Reserve could raise interest rates again in December, pushing Treasury yields higher and placing renewed pressure on technology shares.
The FTSE 100 reversed its early gains, while Wall Street finished lower following Monday's strong recovery.
Meanwhile, oil prices remain relatively subdued, providing some relief for the inflation outlook, although geopolitical uncertainty continues to influence energy markets.
Today's central question is whether investors can look beyond the disappointing inflation figures and focus on cheaper energy, or whether higher bond yields will trigger another period of equity-market weakness.
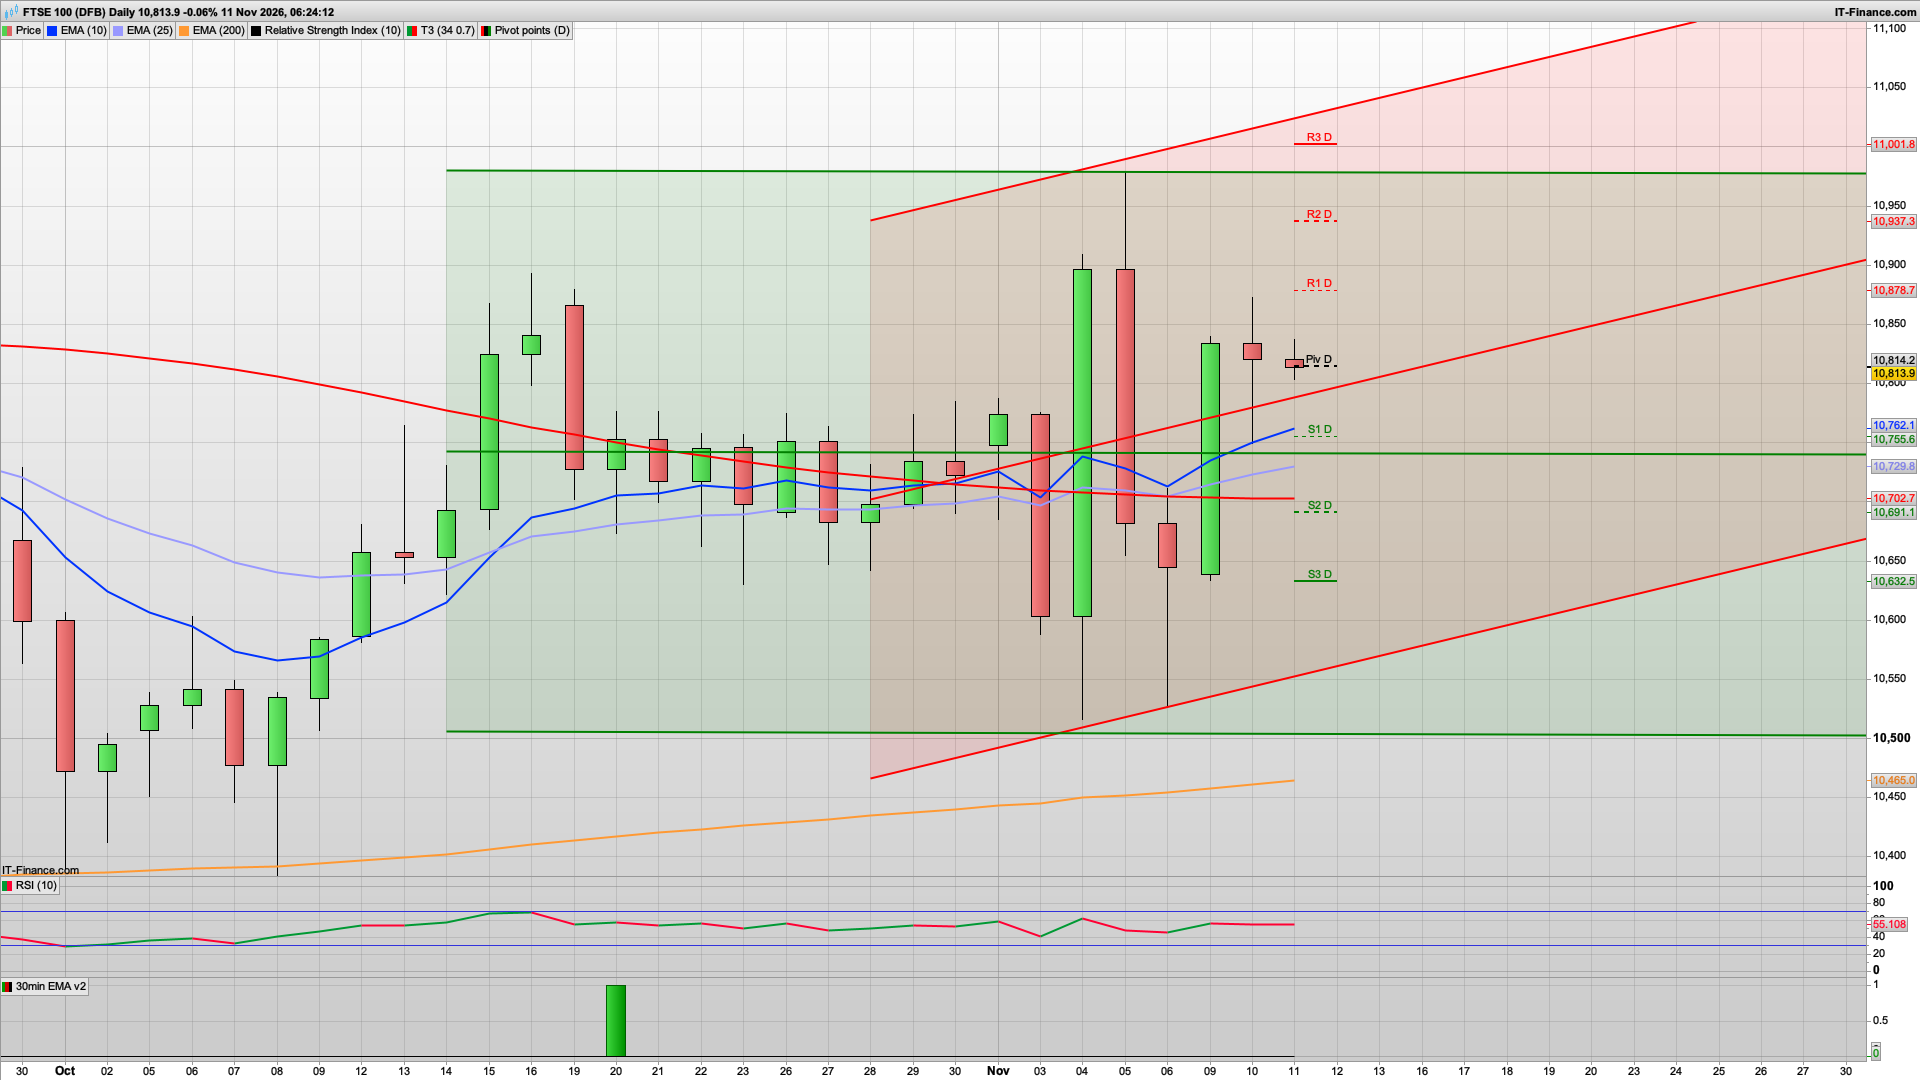
The FTSE has lost some of yesterday evenings bullish momentum. Following a strong recovery earlier in the week, the index is now consolidating around 10810–830, with the 30-minute chart showing repeated failures to establish a sustained move higher.
However, the daily picture remains relatively constructive. Price is still above its 10- and 25-day EMAs, and daily RSI is approximately 55.1, suggesting the broader recovery has not broken down.
My prediction today is for an initial attempt to recover towards 10828 - 10850, followed by a possible rejection towards 10775 if resistance holds.
I favour selling a confirmed rejection at resistance, rather than chasing the FTSE lower at its current level.
Today's bias: Cautiously bearish below 10828-850. However I wouldn't rule out a rise towards the R1 and key fib level at 10880 and if we do see that today then a short here is also worth a go. We have had the bull Monday, bear Tuesday pattern this week and Wednesday can then sometimes be a consolidation/range day - so be aware of that.
The 30-minute chart is showing weaker momentum, but the daily trend remains mildly bullish. This means I expect a potentially range-bound session unless the FTSE breaks decisively above resistance or below support. I am looking at a range of 10770 to 10880.
For more more analysis including other markets please join...
Interested in how to start trading the FTSE 100? Frequently Asked Questions on Spread betting
Recommended Broker for trading - MT4/5, web and mobile

IC - offers market leading pricing and trading conditions by providing clients with True ECN Connectivity; this allows you to trade on institutional grade liquidity from the world’s leading investment banks, hedge funds and dark pool liquidity execution venues. Highly recommended!
Join my Membership for Trading Tips, Support and Resistance Levels with Live Trading
If you would like more detailed analysis for FTSE 100, DAX40, Gold and the S&P500, including the trades that I am looking to take myself, then please join my active members community.
Keep up to date with new website posts, free sign up below